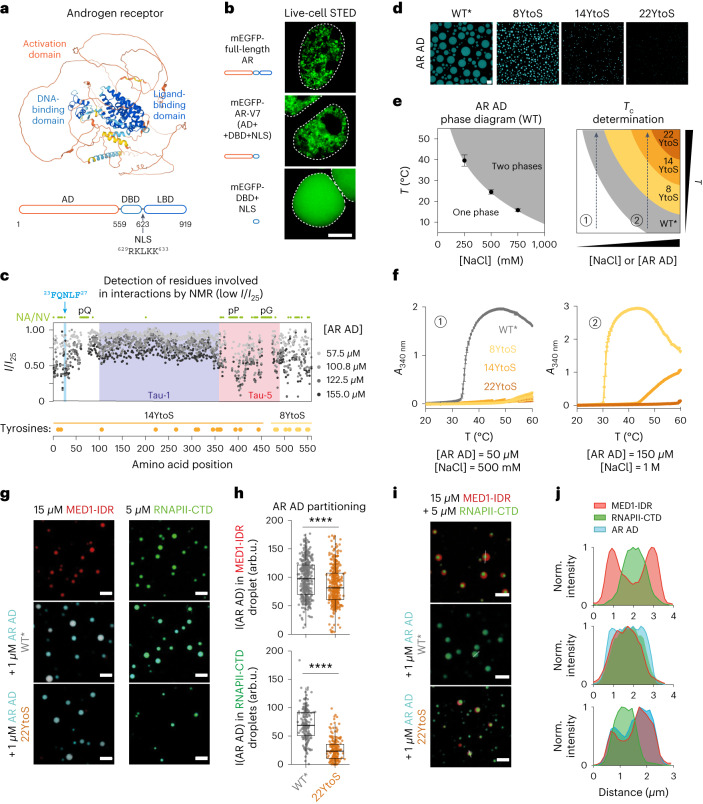
Fig. 1. AR phase separation is driven by tyrosine residues in the AD.
a, Predicted structure of AR, colored by structure-prediction confidence from high (blue) to low (yellow). The domains and the native NLS are highlighted. b, Live-cell STED imaging of representative (n > 3) HEK293T cells transfected with AR constructs tagged with mEGFP. Cells were imaged after treatment with 10 nM DHT for 4 h. Scale bar, 5 μm. The dashed line indicates the nuclear periphery. c, Intensity of AR AD NMR resonances at different concentrations, relative to the intensity at 25 μM. The positions of Tau-1, Tau-5 and 23FQNLF27 are highlighted. Green circles indicate residues that were not visible (NV) or not assigned (NA), including residues in polyglutamine (pQ), polyproline (pP) and polyglycine (pG) tracts. Yellow and orange circles represent the positions of tyrosine residues substituted by serines in 8YtoS and 14YtoS; all tyrosine residues were substituted in 22YtoS. d, Fluorescence microscopy images of 40 µM AR-AD droplets (WT* and mutants) at 1 M NaCl. Scale bar, 10 μm. e, Scheme of the phase diagram of the AR AD and of how Tc measurements at different solution conditions allow the phase separation capacity of the mutants to be ranked. f, Tc measurements of AR AD (WT* and the tyrosine to serine mutants), as mean ± s.d. of three independent samples, at two different solution conditions. g, Representative merged confocal images of 15 µM MED1-IDR and 5 µM RNAPII-CTD droplets at 20 mM NaCl or 50 mM NaCl, respectively, and 10% ficoll before and after addition of 1 µM AR AD (WT* or 22YtoS). Scale bars, 5 μm. h, Quantification of AR AD partitioning in MED1-IDR (top) and RNAPII-CTD droplets (bottom), by measuring AR AD fluorescence intensity (I(AR AD)). Boxes show the mean and the quartiles of all droplets, represented as colored dots from three replicated images. arb.u., arbitrary units. i, Representative (n > 3) merged confocal images of MED1-IDR and RNAPII-CTD droplets obtained in 125 mM NaCl and 10% ficoll with and without the addition of 1 µM AR AD (WT* or 22YtoS). Scale bar, 5 μm. j, Normalized intensity plot of cross-sections from the images shown in i.

