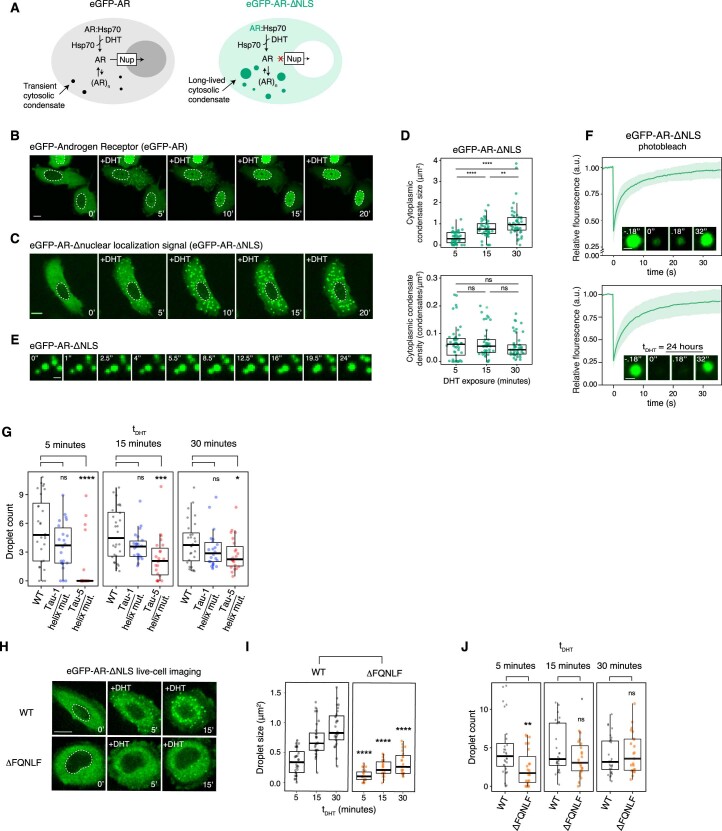
Extended Data Fig. 4. Transactivating units and motifs with helical propensity in AR AD contribute to condensation of AR in vitro and in cells.
a) Schematic model describing the nuclear translocation pathway of eGFP-AR and cytoplasmic retention of eGFP-AR-ΔNLS upon exposure to ligand (DHT). b, c) Time-lapse fluorescence microscopy of eGFP-AR (A) and eGFP-AR-ΔNLS (B) condensates upon treatment with 1 nM dihydrotestosterone (DHT) in transiently transfected PC3 cells. Scale bar: 10 µm. Dashed line indicates the nuclear periphery. d) Distributions of average condensate size and density. Each dot corresponds to the mean values measured in an individual cell (n = 45 cells). Pvalues are from Mann-Whitney U tests. n.s.: not significant. e) Snapshots at the indicated time points highlighting a fusion event of eGFP-AR-ΔNLS condensates in the cytoplasm of a PC3 cell. Scale bar: 1 µm. f) Fluorescence recovery after photobleaching (FRAP) analysis of cytoplasmic eGFP-AR-ΔNLS condensates in PC3 cells 1 hour and 24 h after addition of 1 nM DHT (tDHT ≈ 1 h). Average relative fluorescence intensity curve of the eGFP-AR-ΔNLS cytoplasmic condensates as a function of time is shown. Error bars represent s.d. of n = 34 condensates per time point. Within the box, representative images of condensates before and after photobleaching are shown. Scale bar: 1 µm. g) Effect of the mutations introduced in Tau-1 and Tau-5 on the density of the cytosolic condensates formed by eGFP-AR-ΔNLS as a function of tDHT in PC3 cells. Each dot corresponds to a cell (n > 20 cells). Pvalues are from a Mann-Whitney U test. h) Effect of deleting the region of sequence of the AD containing the 23FQNLQ27 motif on the cytosolic condensates formed by eGFP-AR-ΔNLS upon addition of DHT. Scale bar: 10 μm. The dashed line indicates nuclear periphery. i, j) Effect of deleting the region of sequence of the AD containing the 23FQNLQ27 motif on the distribution of average droplet size (I) and droplet density (J) of the cytosolic condenstates formed by eGFP-AR-ΔNLS as a function of tDHT, where each dot corresponds to a cell (n > 20 cells). Pvalues are from Mann-Whitney U tests.

