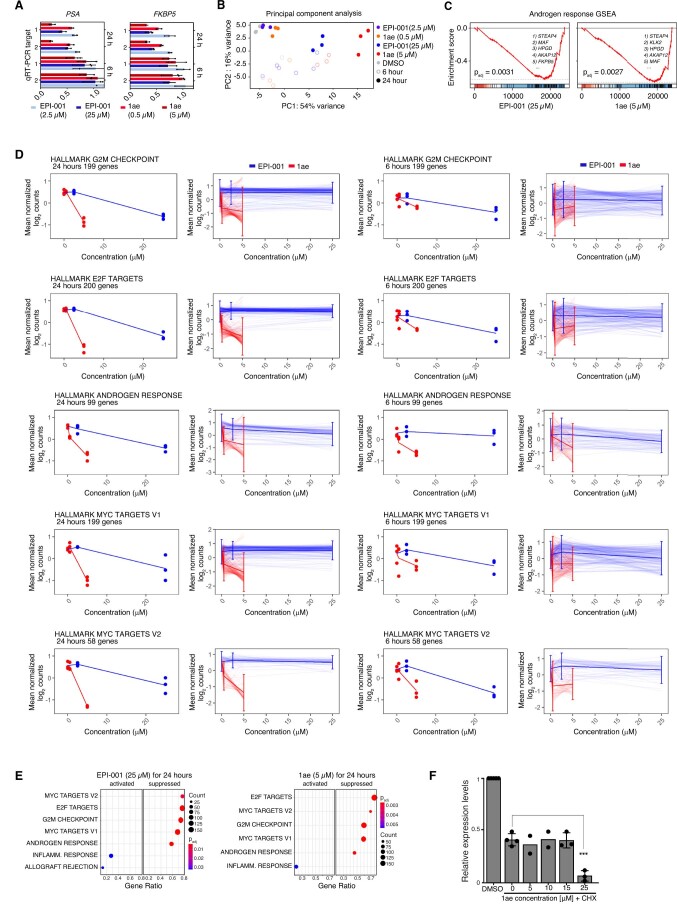
Extended Data Fig. 7. 1ae inhibits AR dependent oncogenic pathways in models of CRPC.
a) qRT-PCR of PSA and FKBP5 transcript targets using two primer pairs for each locus. Values indicate 2-∆∆Ct (Log fold change in target signal versus β-Glucuronidase housekeeping gene signal normalized to values from corresponding DMSO control sample, average ± s.e.m., n = 3). b) Principal component analysis of LNCaP cells treated with EPI-001 or 1ae (n = 3). c) Sequential walk of the GSEA running enrichment score of hallmark androgen response pathway genes in LNCaP cells treated with EPI-001 or 1ae, versus DMSO, for 24 h. Top 5 downregulated genes for EPI-001 and 1ae treatment contributing to the leading edge indicated in top right, and adjusted Pvalue of GSEA statistic indicated in bottom left (n = 3) according to a one tailed t-test comparing calculated NES to the permuted null distribution, with Pvalue adjustment using Benjamini-Hochberg procedure. d) Line plots of mean normalized, log transformed read counts of significantly depleted gene sets in LNCaP cells treated with EPI-001 or 1ae versus DMSO at 24 h (shown in Fig. 6e), as a function of concentration. Light lines represent individual genes, dark lines represent average of all genes, and bars represent s.d. (n = 3). e) GSEA analysis of RNA-seq experiment showing most significantly activated and suppressed pathways for EPI-001 and 1ae treatment, vs DMSO, at 24 h, ranked by the adjusted Pvalue (padj). Gene pathways split by ‘activated’ or ‘suppressed’ based on GSEA enrichment in the gene list ranked by log2FC vs DMSO, in order of gene ratio (detected genes/all genes in pathway) of the analyzed pathway. Circles scale to the count of detected genes from the pathway, and color scales to padj from the pathway (n = 3), according to a one tailed t-test comparing calculated NES to the permuted null distribution, with Pvalue adjustment using Benjamini-Hochberg procedure. f) Quantification of AR signal, versus DMSO control, normalized to GAPDH signal from western blots of LNCaP cells treated with CHX for 3 h, then 1ae at indicated concentrations for 21 h (n = 3, except 5 and 10 μM where n = 2).

