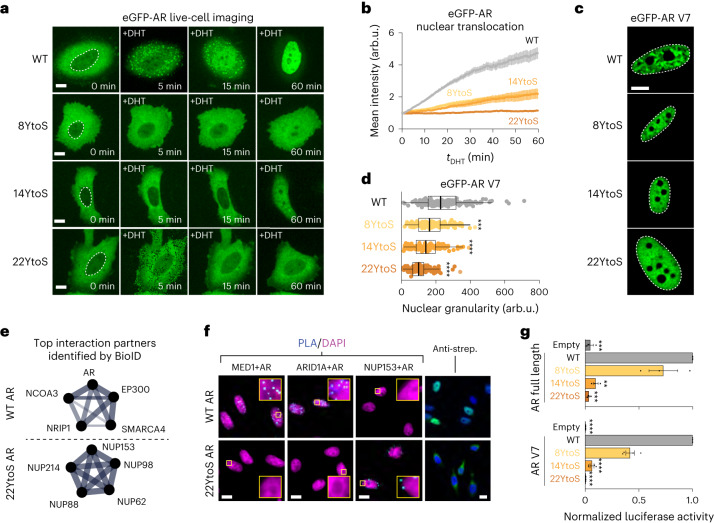
Fig. 2. AR phase separation is associated with nuclear translocation and transactivation.
a, Fluorescence images from live-cell time-lapse videos of PC3 cells expressing eGFP-AR or the indicated mutants. Scale bar, 10 μm. b, Quantification of eGFP-AR relative nuclear localization for the cells in a, as a function of time elapsed since the addition of 1 nM DHT (tDHT). Error bars represent the s.d. of n ≥ 15 cells per time point. c, Representative images (n > 3) of live PC3 nuclei expressing eGFP-AR-V7 WT or a Tyr to Ser mutant. Scale bar, 5 μm. d, Quantification of the nuclear granularity for the cells in c; each dot represents one nucleus, boxes show the mean of the quartiles of all cells and P values were calculated using a Dunnett’s multiple-comparison test against the WT (n ≥ 150 cells per condition). e, Selected Gene Ontology (GO) molecular function networks enriched in the top 75 most abundant hits (Bayesian false discovery rate (BFDR) ≤ 0.02, fold change (FC) ≥ 3) for the indicated bait. Two protein–protein interaction networks are shown: androgen receptor binding (for WT) and structural constituent of the nuclear pore (for 22YtoS). The line thickness corresponds to the strength of published data supporting the interaction, generated from STRING (string-db.org). Additional GO results are provided in Extended Data Fig. 3h and Supplementary Data Table 1. f, Representative results of PLAs in DHT-treated PC3 cells using the indicated antibodies are shown in cyan, with DAPI staining in magenta (n > 3). Streptavidin (strep.) labeling is shown in green, with DAPI in blue (far right) in DHT-treated PC3 cells. The boxes correspond to magnified regions of the images, that illustrate the differences in interactions between WT AR and 22YtoS. Scale bars, 10 μm. g, Transcriptional activity (average ± s.e.m.) of AR and Tyr to Ser mutants, assessed using a luciferase reporter assay for AR (tDHT = 1 h, top) or AR-V7 (bottom) in HEK293 cells. Empty stands for empty vector, and P were calculated using a Dunnett’s multiple-comparison test against the WT (n = 3, top; n = 4, bottom).

