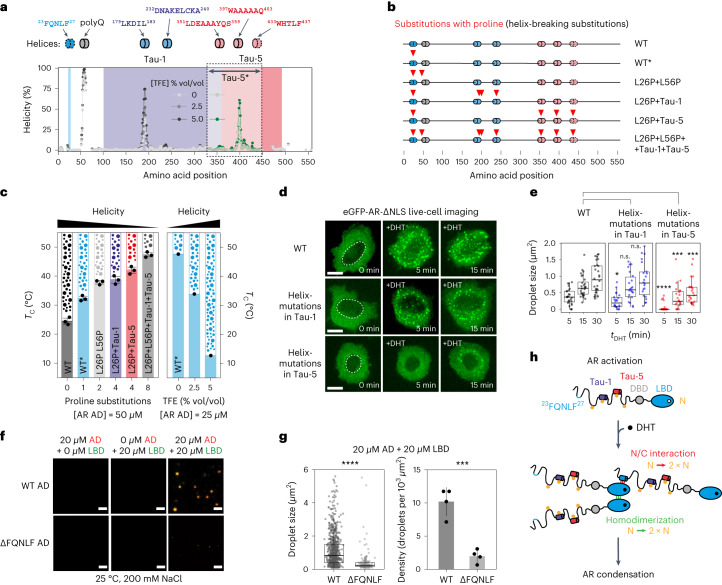
Fig. 3. Short transient helices enhance AR phase separation.
a, Annotation of short helical motifs in the AR AD. The plots show the helical propensity of the WT* AD, measured by NMR in the absence or presence of 2.5% or 5% TFE. Tau-1 and Tau-5 are highlighted. A discontinuous contour indicates motifs that fold when bound to globular binding partners. Helicity values were derived from the main-chain chemical shifts by using δ2D (ref. 67). Green values are from an equivalent experiment carried out with the Tau-5* construct (ref. 23), which was done because the most informative resonances are invisible in AR AD owing to their involvement in transient long-range interactions. b, The mutants that were used to investigate the effect of reduced helical propensity on phase separation. The color code is the same as that in a. c, Tc measurements of purified AR AD proteins containing proline substitutions (mean ± s.d., n = 3 independent samples), or in the presence of TFE. The solid shading represents the one-phase regime, and droplets represent the two-phase regime. d, Representative (n > 3) live-cell fluorescence microscopy images of DHT-treated PC3 cells expressing the indicated eGFP-AR-ΔNLS mutants. Scale bar, 10 μm. e, Distributions of droplet size for eGFP-AR-ΔNLS and mutants in PC3 cells as a function of tDHT. Each dot corresponds to the mean droplet size in a single cell (n > 20 cells), boxes shown the mean and the quartiles of all cells and P values were calculated using a Mann–Whitney U test. n.s., not significant. f, Representative (n > 3) fluorescence microscopy images of purified AR AD (WT and ΔFQNLF), the LBD and an equimolar mixture of the two proteins in vitro. In the images, the red (AR AD) and green (LBD) channels are merged; 200 mM NaCl and 20 μM protein were used. Approximately 1% of the total amount of protein is labeled. Scale bars, 5 μm. g, Distributions of the size of droplets (n = 750 droplets for WT and n = 150 for ΔFQNLF) from the samples in f, where boxes show the mean and quartiles of all droplets, and average density of droplets in the cells (n = 4 independent samples). h, Scheme illustrating how the N/C interaction and LBD homodimerization each double the valency (N) of the freely diffusing AR species, thus increasing AR phase separation propensity.

