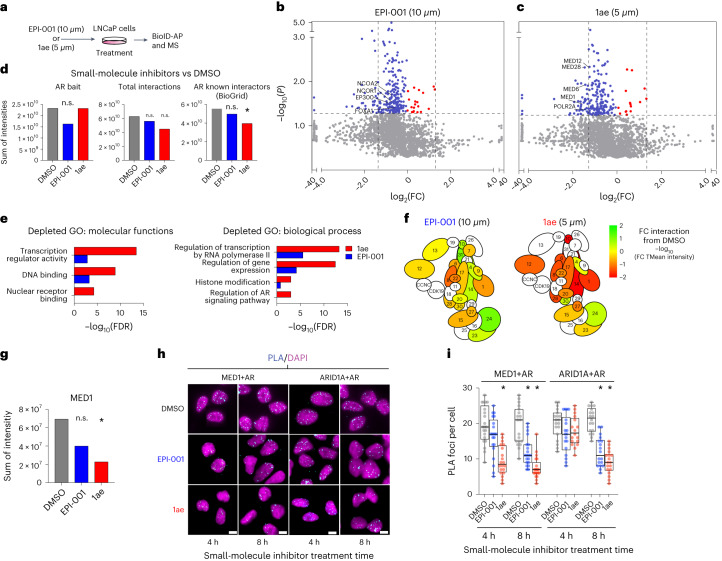
Fig. 5. 1ae decreases interactions between AR and the transcription machinery.
a, Schematic of the method for small-molecule treatment of cells and the BioID experiment. b, BioID–MS of LNCaP MTID-AR-WT cells treated with EPI-001 (10 μM, 1 h), followed by treatment with DHT and biotin (2 h). Intensity data were obtained from SAINTq analysis. Shown is the log2(FC) of the intensity of the interaction in inhibitor-treated versus DMSO-treated cells. Decreased interactors in inhibitor-treated cells relative to DMSO-treated cells are shown in blue; P < 0.05. The dashed lines mark where log2(FC) < −1.5. Increased interactors in inhibitor-treated cells relative to DMSO-treated cells are shown in red; P < 0.05. The dashed lines mark where log2(FC) > 1.5. Proteins of interest are annotated (n = 3). c, As in b, BioID–MS of LNCaP MTID-AR-WT cells. Cells were treated for 1 h with 1ae (5 μM) and then for 2 h with DHT and biotin (n = 3). d, (Total mean) TMean intensities of peptides identified by MS (n = 3) from SAINTq data of individual proteins (bait), total interactors (all) or collated known AR interactors sourced from BioGrid (https://thebiogrid.org/) were compared between LNCaP MTID-AR-WT cells treated with DMSO and those treated with small-molecule inhibitors. e, GO search terms of key biological processes and molecular functions in SAINTq intensity data from b and c (BFDR < 0.02, depleted = log2(FC) < −1.5), obtained from the LNCaP MTID-AR-WT cells treated with small-molecule inhibitors versus DMSO. Full categories are available in Supplementary Data Table 2. f, BioID–MS of the LNCaP MTID-AR-WT interaction with Mediator complex in cells treated with small-molecule inhibitors versus DMSO. SAINTq data, color indicates strength of interaction change from logFC10 TMean of intensity. g, The TMean intensity of interactions with the MED1 subunit of Mediator was compared between LNCaP MTID-AR-WT cells treated with DMSO or small-molecule inhibitors. SAINTq data were used. Statistical significance was determined by Student’s t-test against the control group. h, Results from a PLA in LNCaP MTID-AR-WT cells, using the indicated antibodies shown in cyan with DAPI staining shown in magenta. Cells were treated with small-molecule inhibitors or DMSO and DHT at the indicated times. Scale bars, 10 μm. i, Distributions of PLA foci per cell, each dot corresponds to a cell and boxes shown the mean and quartiles of all cells (n > 20 cells).

