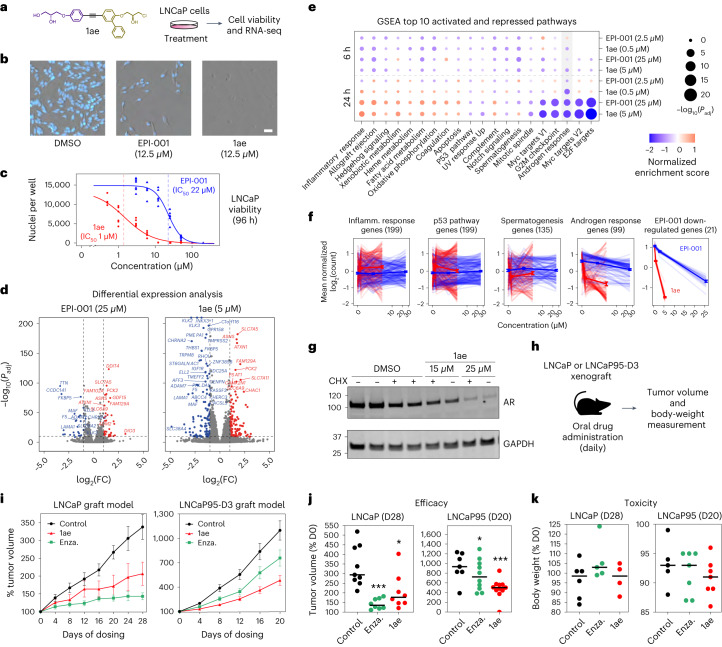
Fig. 6. Compound 1ae inhibits AR-dependent transcription and tumor growth.
a, Structure of 1ae, and a schematic of the experiment used to investigate its effect on LNCaP cells. b, Representative (n > 3) images of LNCaP cells (stained with Hoechst) after 96 h of treatment. Scale bar, 50 μm. c, Dose–response curve (log-logistic fit) of viable LNCaP nuclei, with IC50 values calculated from the dose–response curve (n = 6). d, Volcano plots of differentially expressed genes in LNCaP cells treated with EPI-001 or 1ae for 24 h at a concentration near the IC50 versus cells treated with DMSO (fold change cutoffs: 2×, 0.5×). (Supplementary Data Table 3). e, Gene set enrichment analysis of the top 10 enriched and top 10 depleted msigdb hallmark signature pathways68 in LNCaP cells treated with EPI-001 or 1ae versus those treated with DMSO. Circle size represents the significance of the normalized enrichment score (log(Padj)), and the color gradient represents normalized enrichment score of the indicated pathway analyzed with GSEA. The hallmark androgen-response pathway is highlighted in gray (n = 3). f, The log transformation of mean normalized counts of the indicated gene sets in LNCaP cells treated with EPI-001 or 1ae. Light lines represent individual genes, dark lines represent average of all genes and the shaded areas represent the standard error (n = 3). g, Representative (n = 3) western blot of endogenous AR in LNCaP cells pretreated with cycloheximide (CHX) for 3 h, which were then treated with 1ae for 21 h. GAPDH was used as the loading control (bottom). h, Schematic of the LNCaP and LNCaP95-D3 xenografting procedure in the CRPC model. i, Tumor volume in mice with LNCaP (left) or LNCaP95-D3 (right) xenografts. Values are presented as the mean percentage relative to the volume measured at the first day of treatment with the error bars representing the s.e.m. of n ≥ 8 (LNCaP) or n ≥ 7 (LNCaP95-D3) tumors per treatment group. Enza., enzalutamide. j, Tumor volume on day 28 or 20 of the experiments, presented as the percentage relative to the volume measured at the first day of treatment. k, Body weight of animals on day 28 or 20 of the xenograft experiments, presented as percentages relative to the body weight measurement on the first day of treatment. Horizontal bars in j and k represent the median.

