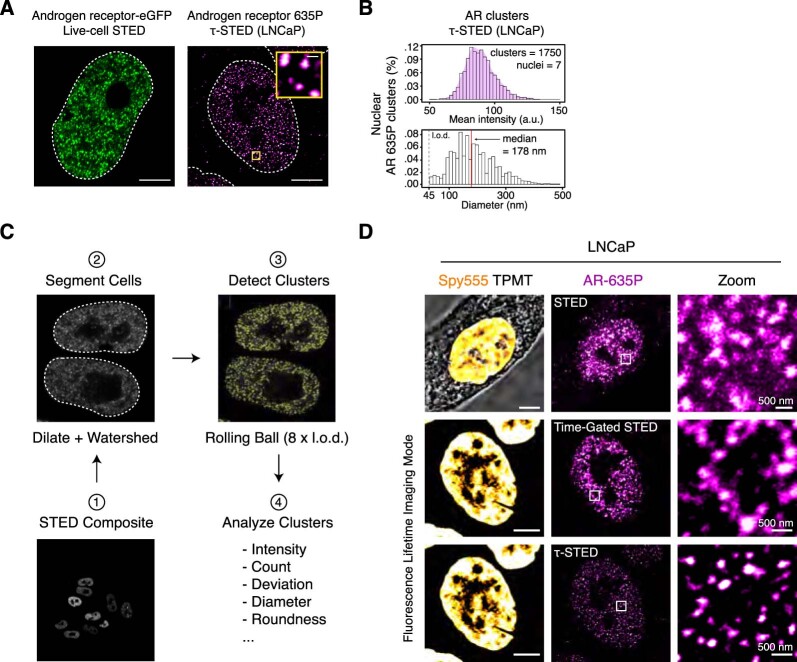
Extended Data Fig. 1. Characterization of AR condensates in cells using high resolution microscopy.
a) (left) Live-cell stimulated emission depletion (STED) imaging of a HeLa cell nucleus expressing AR-eGFP, treated with 1 nM DHT for 4 h (right) τ-STED imaging of endogenous AR in fixed human prostate adenocarcinoma (LNCaP) cells. Large scale bars: 5 μm. Scale bar in τ-STED inset: 300 nm. Dashed line indicates the nuclear periphery. b) (top) Quantification of τ-STED intensity signal and (bottom) diameter of endogenous AR clusters in LNCaP cells (1750 AR clusters detected across 7 LNCaP nuclei imaged with same fluorescence time gating). L.o.d indicates the limit of detection. Densitymax diameter (bin with highest density of AR clusters in the distribution of all detected AR clusters): 123 nm, median diameter: 178 nm. c) Quantification pipeline used to analyze STED image composites, showing segmentation of cells and detection of clusters using rolling ball background subtraction adjusted to 8 x the resolving capacity of the image (48 nm pixel-1 for TauSTED imaging of LNCaP cells). d) Representative (n > 3) STED (top row) and FLIM STED images showing AR clusters in LNCaP nuclei before and after τ-STED deconvolution (middle and bottom row). Left column shows LNCaP nuclear counterstain using Spy555-DNA stain. Scale bar: 5 μm. Right panels show zoom-ins corresponding to intra-nuclear regions indicated by white boxes on panels in the central column. Scale bar: 500 nm.

