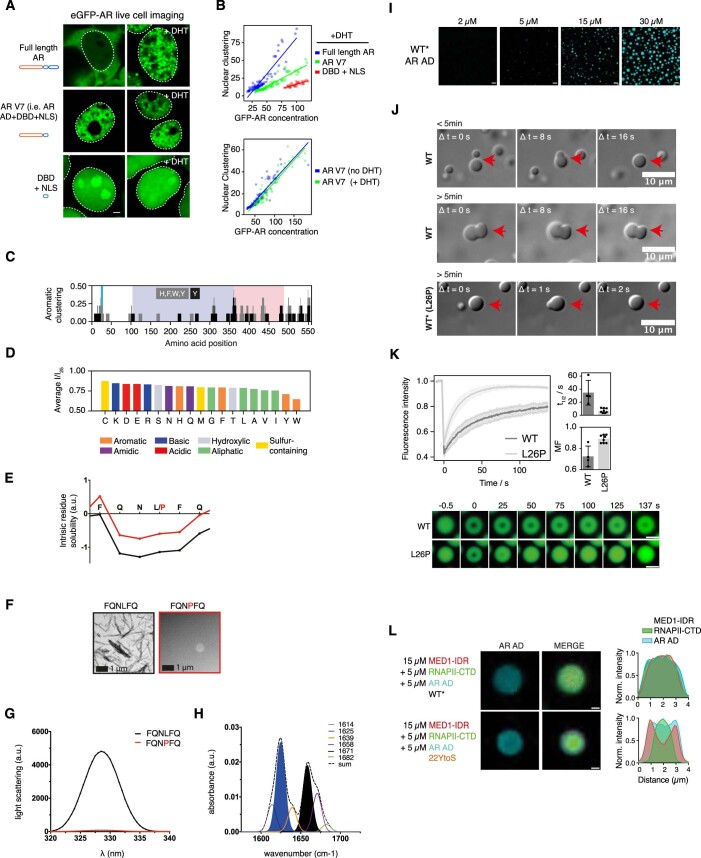
Extended Data Fig. 2. AR phase separation is driven by tyrosine residues in the AD.
a) Live-cell confocal imaging of constructs in HEK293T cells after treatment with vehicle or 10 nM DHT for 4 h. Scale bar: 3 µm. Dashed lines indicate nuclear periphery. b) Quantification of data in panel A. Y-axis indicates s.d. and x-axis indicates mean intensity of pixels in the corresponding nucleus. Each dot represents measurements from an individual cell, and lines represent standard regression fits to the corresponding data spread (n = 2). c) Distribution of aromatic and tyrosine residues, clustered using a 9 residue window, where the shaded areas correspond to those represented in Fig. 1c. d) Average intensity of the resonances at different concentrations, relative to their intensity at 25 μM, grouped by residue type. e) Solubility predicted by CamSol for peptides FQNLFQ (black line) and FQNPFQ (red line)99. f) Representative (n > 3) TEM micrographs of peptides FQNLFQ and FQNPFQ after an overnight incubation. g) Synchronous light scattering of peptides FQNLFQ (black line) and FQNPFQ (red line) after an overnight incubation. h) FT-IR absorbance spectrum in the amide I region (dashed line) of the aggregates formed by the FQNLFQ peptide. The blue shaded area indicates the contribution of the intermolecular β-sheet signal. i) Fluorescence microscopy images of AR AD (WT*) droplets in 20 mM sodium phosphate, 1 mM TCEP pH 7.4 with 150 mM NaCl and 10% ficoll. Scale bar: 10 µm. j) DIC images showing fusion events of 50 μM AR AD WT or WT* samples at 500 mM NaCl at times before and/or after 5 min from sample preparation. k) Fluorescence intensity recovery curves shown as average and s.d. (n = 3 independent samples) and quantification of the recovery half-time and mobile fraction (average ± s.d., n = 4 and n = 8 droplets for WT and L26P (WT*) respectively) and representative confocal microscopy images. l) (Left) Droplets formed by the indicated proteins and signals of the AR AD channel and merged channel. AR AD proteins were used concentrations 5 times higher than in Fig. 1i. Scale bar: 1 µm. (Right) the representative droplet’s cross-section intensity profile.

