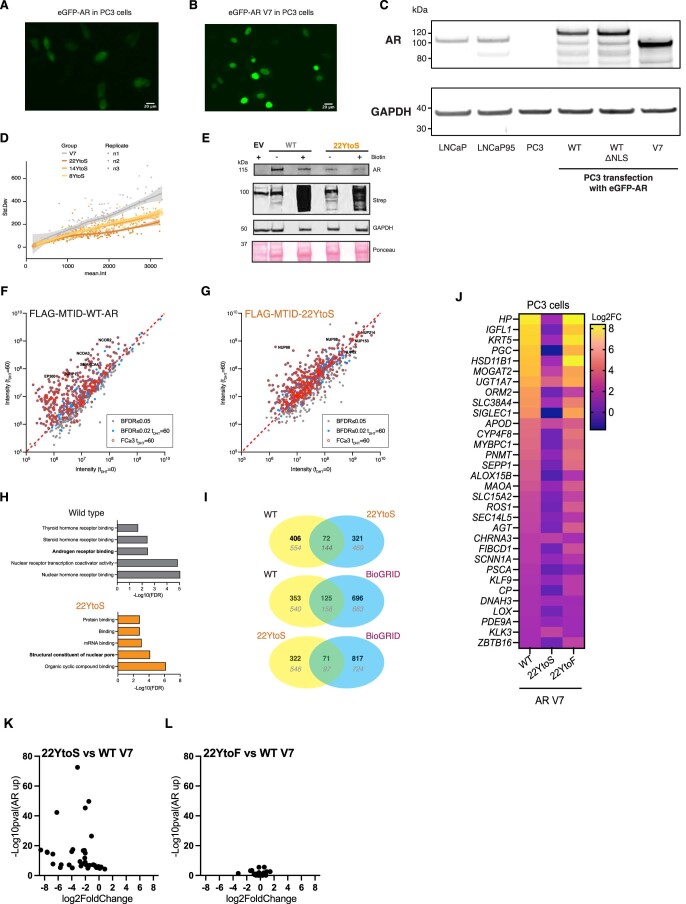
Extended Data Fig. 3. Tyrosine to serine mutations decrease AR granularity, translocation and alter its interactome.
a, b) Representative (n > 3) images of PC3 cells expressing eGFP-AR (A) and eGFP-AR V7 (B). c) Expression levels of transfected PC3 cells with eGFP-AR constructs and endogenous levels of AR in LNCaP and LNCaP95 cells. GAPDH was used as loading control. d) Quantification of the granularity (s.d.) as a function of the mean nuclear intensity. e) Western blot of FLAG-MTID-AR or FLAG-MTID-Y22toS proteins in PC3 cells. f, g) Scatter plot of the protein intensities at tDHT = 0 and 60 min for PC3 cells expressing FLAG-MTID-WT-AR (F) and FLAG-MTID-22YtoS (G) following SAINTq analysis. Proteins with a BFDR ≤ 0.05 are shown (gray circle) and those with a BFDR ≤ 0.02 and/or FC ≥ 3in tDHT = 60 min are highlighted in blue and red. h) Enriched gene ontology molecular function (GO-MF) categories in FLAG-MTID-WT-AR and FLAG-MTID-22YtoS samples (tDHT = 60 min). The 75 most abundant proteins, with a cutoff of BFDR ≤ 0.02 and FC ≥ 3, were analyzed using STRING and GO categories. The -log10(FDR) for selected categories are shown: those highlighted in Fig. 2e are in bold (Supplementary Data Table 1. i) Venn diagrams showing proteins identified in WT and 22YtoS (top), WT and AR interactions reported in BioGRID and Y22toS and AR interactions reported in BioGRID. Number of proteins identified (tDHT = 0 and 60 min) with a BFDR ≤ 0.02 and a FC ≥ 3 in bold and numbers of proteins identified with a BFDR ≤ 0.05 in gray (Supplementary Data Table 1). j) Gene expression in AR-V7 mutants: heatmap of log2 fold changes (log2FC) compared to the empty vector transduced control PC3 line (Supplementary Data Table 5). Selected genes shown are a composite of several GSEA ‘AR up’ genesets (Broad Institute) upregulated by AR V7 in PC3 cells. K, L) Scatter plots of the selected genes comparing 22YtoS (k) or 22YtoF (l) to WT AR V7 according to a one-tailed t-test comparing calculated NES to the permuted null distribution, with Pvalue adjustment using Benjamini-Hochberg procedure.

