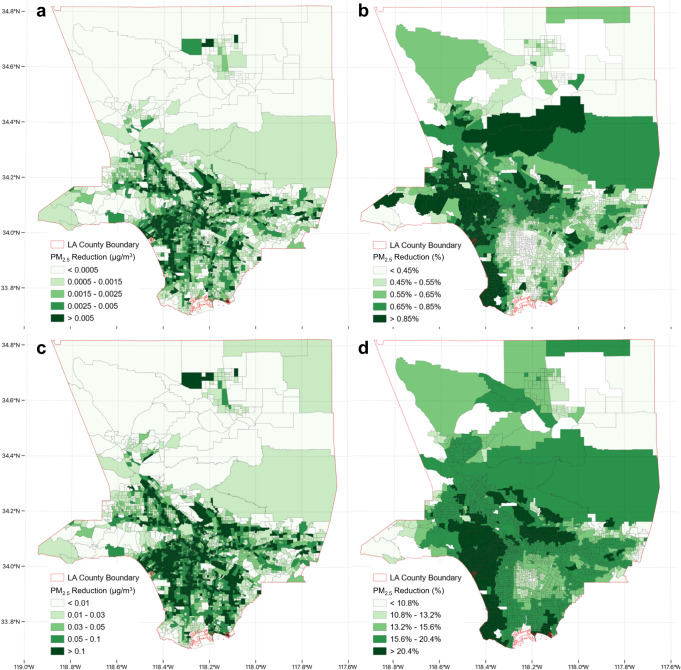
Fig. 6. Spatial distribution of near-roadway fine particulate matter (PM2.5) reduction attributable to zero-emission vehicles (ZEVs) in Los Angeles County in 2020 and 2035.
a PM2.5 in μg/m3, (b) PM2.5 as a percentage in 2020; (c) PM2.5 in μg/m3, (d) PM2.5 as a percentage in 2035. The percentage (relative reduction) is calculated by dividing the ZEV-attributable reduction by the total traffic-attributable pollutant concentration in each census tract. The deeper the green color, the greater the reduction observed.

