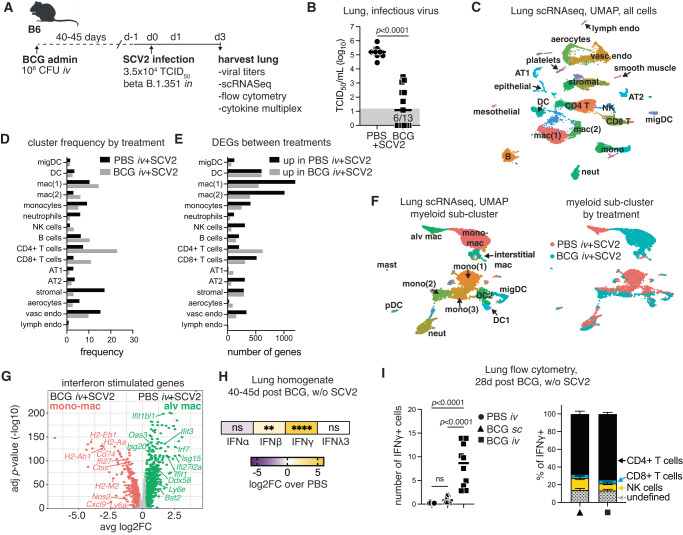
Fig. 1. iv BCG skews the pulmonary cytokine landscape towards IFNγ production.
B6 mice were inoculated with BCG or PBS iv 40–45 days prior to intranasal challenge with SARS-CoV-2 (SCV2) B.1.351. Lungs were harvested 3 days after viral challenge. A Schematic of the experimental protocol. B Viral titers in lung homogenate as measured by TCID50 assay (PBS n = 14, BCG n = 13; pooled from two independent experiments; two-tailed Mann–Whitney test). Gray box shows values below limit of detection. C UMAP representation of scRNAseq data of the whole lung isolated from BCG and PBS animals challenged with SARS-CoV-2. Clustering resolution: 0.6. Cluster-specific annotation is shown in Fig. S1A and gene sets in Supplementary Data 1. D Frequency of cells in each cluster separated by experimental condition. E Number of differentially expressed genes (log2FC > 0.25, p < 0.05, Wilcoxon Rank-Sum test with Bonferroni correction) between PBS and BCG groups for each cluster. Gene lists with their associated FC and p values are in Supplementary Data 2. F UMAP representation of sub-clustered myeloid cells for PBS or BCG-treated animals (left) and UMAP colored by treatment group (right). Clustering resolution: 0.4. Cluster-specific annotation is shown in Fig. S1D and gene sets in Supplementary Data 3. G Volcano plot shows DEGs with annotated ISGs between resident AM and monocyte-derived macrophage clusters (log2FC > 0.25, p < 0.05, Wilcoxon Rank Sum test with Bonferroni correction). The full gene list with their associated FC and p values are in Supplementary Data 4. H Fold change in interferon protein levels in lung homogenate between PBS and BCG-treated mice without SARS-CoV-2 challenge (PBS n = 13, BCG n = 12; pooled from three independent experiments; one-way ANOVA with Tukey post-test). Not significant (ns) p > 0.05; **p = 0.0018; ****p < 0.0001. I Flow cytometry data showing the number of total IFNγ+ cells (left panel) and the cellular composition of IFNγ+ cells (right panel, mean ± SEM) isolated from the lungs of mice 28 days after BCG was administered by subcutaneous (sc, triangle) or iv injection (square) (PBS n = 8, BCG sc n = 10, BCG iv n = 10; pooled from two independent experiments; one-way ANOVA with Tukey post-test). Not significant (ns) p > 0.05. Source data are provided as a Source Data file.

