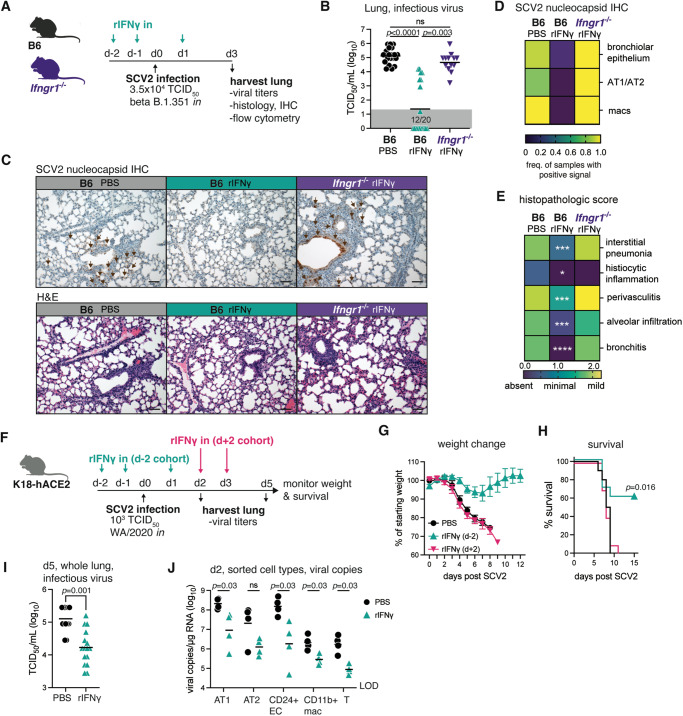
Fig. 6. Intranasal administration of recombinant IFNγ prior to viral challenge confers strong protection against SARS-CoV-2.
A–E B6 or Ifngr1−/− mice were infected with SARS-CoV-2 (SCV2) B.1.351 and lungs harvested for analysis 3 dpi. Animals were treated with PBS or rIFNγ intranasally on days −2, −1, and 1 relative to viral challenge. A Schematic of experimental protocol. B Viral titers in lung homogenate as measured by TCID50 assay (B6 n = 20/group; pooled from four independent experiments. Ifngr1−/− n = 13; pooled from three independent experiments. Kruskal-Wallis with Dunn’s post-test). Not significant (ns) p > 0.05. Gray boxes denote values below limit of detection. C Representative lung histology images stained for SARS-CoV-2 nucleocapsid (upper panel) or H&E (lower panel) from two independent experiments. Scale bar = 50 µm. D, E Heat map representation of SARS-CoV-2 positivity across different cell types (D) or histopathologic score (E) as assessed by a study-blinded veterinary pathologist (B6 n = 10/group; pooled from two independent experiments; two-tailed Mann–Whitney test between B6 PBS and B6 rIFNγ groups). Interstitial pneumonia p = 0.0003, histiocytic inflammation p = 0.011, perivasculitis p = 0.0007, alveolar infiltration p = 0.0004, bronchitis p < 0.0001. F–J K18-hACE2 mice were infected with SARS-CoV-2 WA/2020. Animals received intranasal PBS or rIFNγ at the indicated time points. F Schematic of experimental protocol. G Percent of starting weight (mean ± SEM) and H survival over time following viral challenge (n = 10 mice/group; pooled from two independent experiments; Mantel–Cox test). I Viral titer in lung homogenate 5 dpi as measured by TCID50 assay (PBS n = 13, rIFNγ n = 16; pooled from two independent experiments; two-tailed Mann–Whitney test). J Single-cell suspensions were prepared from lungs at 2 dpi. Cells were pooled into two replicates/experimental treatment groups each containing cells from 2–3 mice. The indicated cell types were sorted as per the gating strategy in Fig. S7. RNA was directly extracted, and viral copies were measured by PCR (n = 4/group; pooled from two independent experiments; two-tailed Mann–Whitney test). Not significant (ns) p > 0.05. LOD = level of detection. Source data are provided as a Source Data file.

