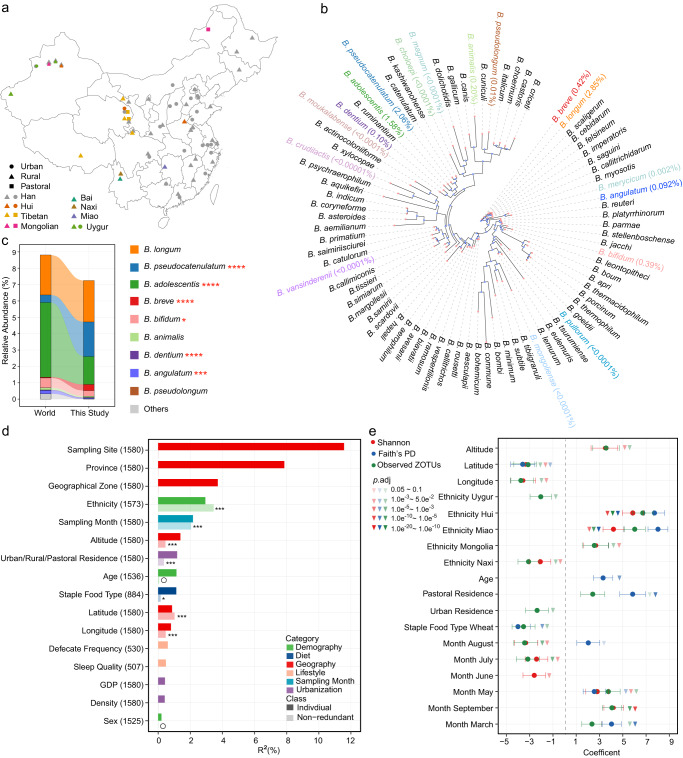
Fig. 1. Diversity of Bifidobacterium species in the Chinese gut and associated covariates.
a Geographical distribution of sampling sites, ethnic groups, and urbanization status. b The phylogenetic tree of groEL gene of Bifidobacterium species. A total of 82 Bifidobacterium species with genome deposited in NCBI database were included, and one sequence from each species was randomly selected from the NCBI database accessed on 20 August 2021. The 17 species found in this study are highlighted by different colors, and their mean relative abundances are shown in brackets. c Composition of the bifidobacterial community in this study and the World data. *p.adj < 0.1, ***p.adj < 0.01, ****p.adj < 0.001, linear regression with adjustment for age and sex. This study, n = 1413; World, n = 4516. d Covariates correlated with the beta diversity of the gut bifidobacterial community estimated with Bray–Curtis dissimilarity. Nineteen variables having more than 500 samples with non-missing data were analyzed using dbRDA separately, and the variance explained by each of these variables is indicated with darker colors; 16 covariates with p.adj < 0.1 are shown. Nine representative variables having >800 samples with non-missing data were analyzed using a stepwise dbRDA, and the non-redundant variance explained by each of these variables is indicated with lighter colors; **p.adj < 0.05, ***p.adj < 0.01, and nonsignificant covariates are indicated with an open circle; n = 884. The number of samples is indicated in brackets following the name of each covariate. e Covariates associated with the alpha diversity of the gut bifidobacterial community. The nine representative variables used in d were subjected to z score normalization and then analyzed using a ridge regression model. Error bars indicate standard errors of the coefficients. n = 884.

