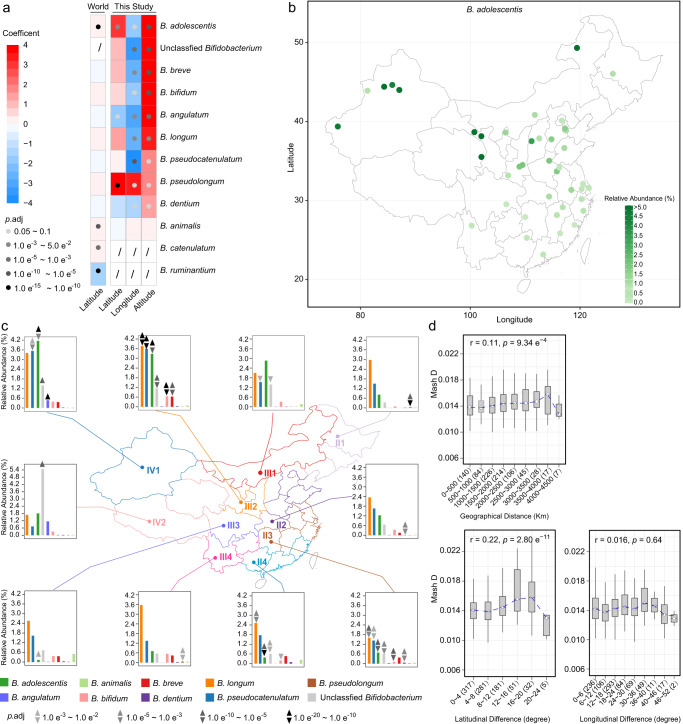
Fig. 2. Geographical distribution of gut Bifidobacterium species.
a The association between geographical factors and the abundance of Bifidobacterium species. Coefficient and p.adj values from ridge regression for this study and those from multiple linear regression for the World data are shown. z score normalization of continuous variables and relative abundances was performed prior to regression analyses. This study, n = 884; World, n = 4516. b Relative abundance of B. adolescentis in different sampling sites across China. Each dot represents a sampling site; the color of the dot indicates the mean value in each site; sampling sites with at least 15 samples are shown. n = 1528. c Relative abundances of the nine most abundant Bifidobacterium species as well as unclassified Bifidobacterium in different geographical zones in China. The 10 geographical zones are indicated by different colors, and the mean relative abundances of Bifidobacterium species in each zone are shown in the bar plot. Geographical zone-specific species (p.adj < 0.01) are indicated by triangles (linear regression, n = 1413) and inverted triangles (ridge regression, n = 884) with different greyscale. a, c Age and sex were included as confounding factors in linear regression models; age, sex, ethnicity, sampling month, staple food type, and urban/rural/pastoral residence were included in ridge regression models in a; age, sex, ethnicity, sampling month, and urban/rural/pastoral residence were included in ridge regression models in c. d Mash distance between B. pseudocatenulatum genomes in different geographical groups. The center line of the boxplot represents the median, box limits represent upper and lower quartiles, and whiskers represent 1.5× interquartile range. The number of site pairs in each distance range is indicated in brackets. The associations between geographical distance and Mash distance were evaluated using Pearson’s correlation tests, and the coefficient and p values are shown.

