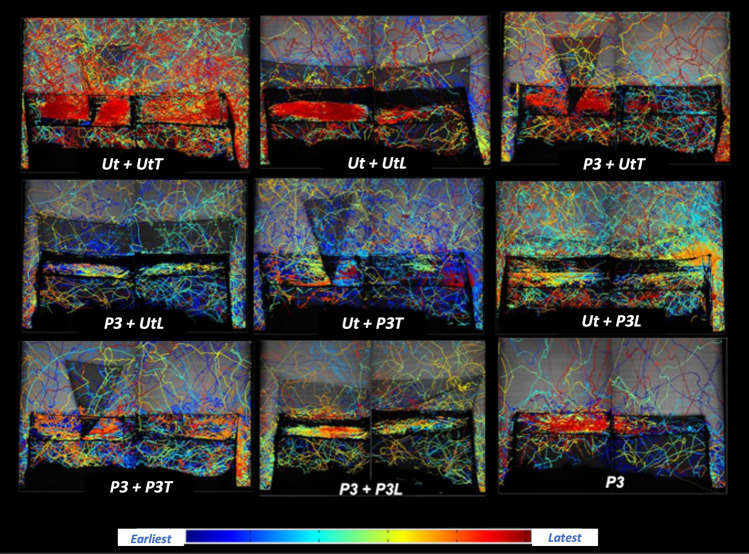
Figure 5.
Examples of 120-min composite images showing all flight tracks of An. gambiae Tiassale strain at each of the BBnet variants. In all images, the sleeper is lying on their back, with their head at the left. Each colored track is the path of a single mosquito flight event, (25 mosquitoes released simultaneously) in all tests and color-coded according to time of appearance as shown in the key: blue tracks at the start through to red at the end of the 120-min test.

