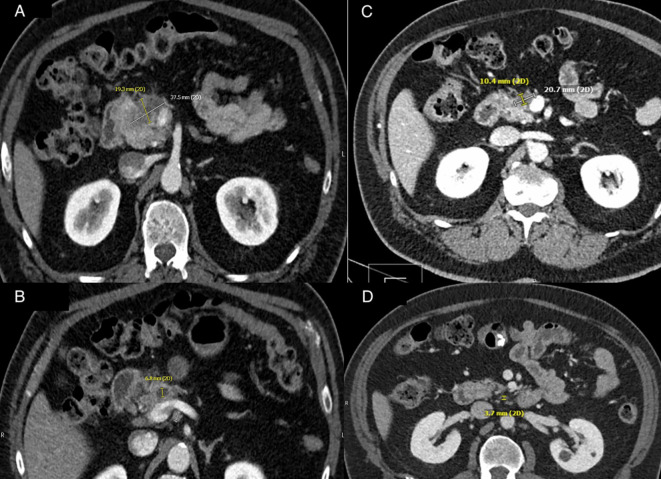
Figure 2.
(A) CT abdominal imaging of pancreatic mass at time of diagnosis. A heterogeneous hypodense mass at anterior pancreatic head measuring 3.8 cm × 1.9 cm with associated pancreatic ductal obstruction. (B) CT abdominal imaging of lymphadenopathy at time of diagnosis. Lymph node posterior to the uncinate process measuring 10 mm on axial imaging. (C) CT abdominal imaging of pancreatic mass after five cycles of chemotherapy. Pancreatic mass with interval decrease in size to 2.1 cm × 1.0 cm. (D) CT abdominal imaging of lymphadenopathy after five cycles of chemotherapy. Interval decrease in size of lymph node posterior to the uncinate process measuring 3.7 mm on axial imaging. Created with BioRender.com.

