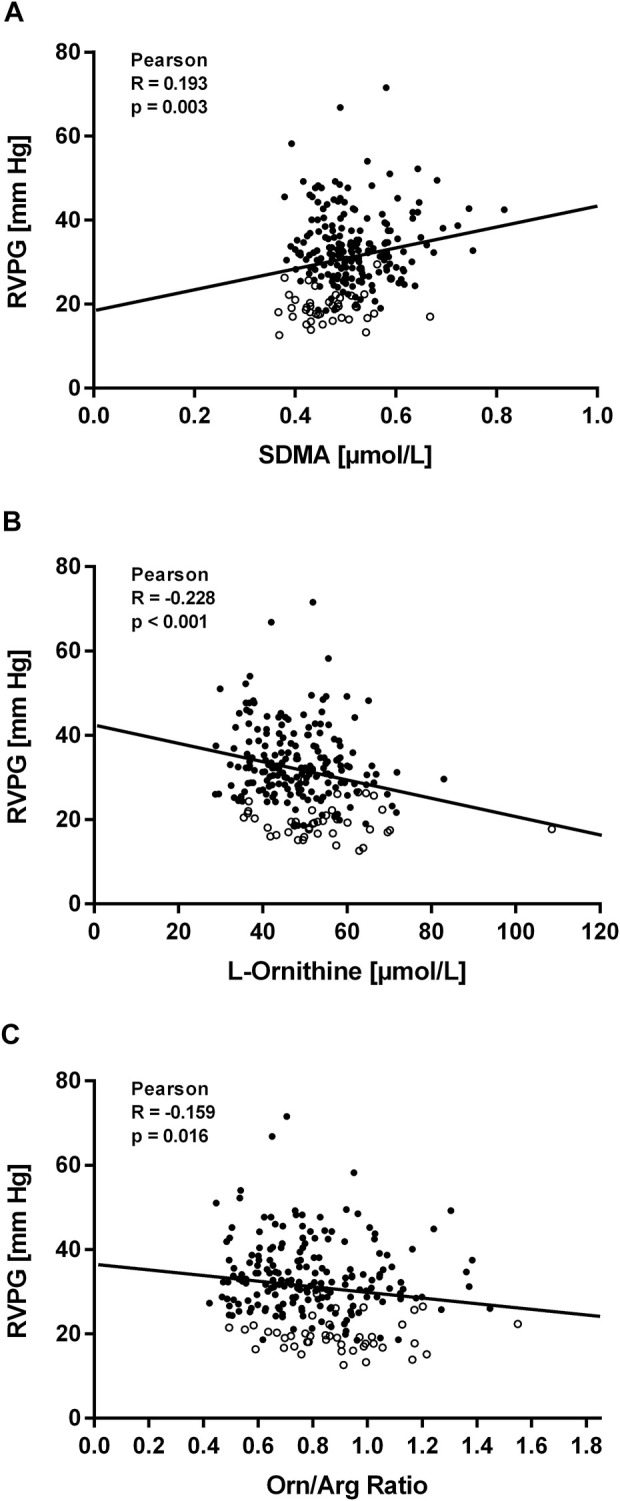
FIGURE 4.

Correlations of biomarkers with right ventricular pressure gradient (RVPG) in participants of study (A). Data are shown for SDMA (A), L-ornithine (B), and L-ornithine/L-arginine ratio (C). Open symbols represent baseline measurements taken at low altitude, filled symbols represent measurements taken at high altitude at the times specified in Methods.
