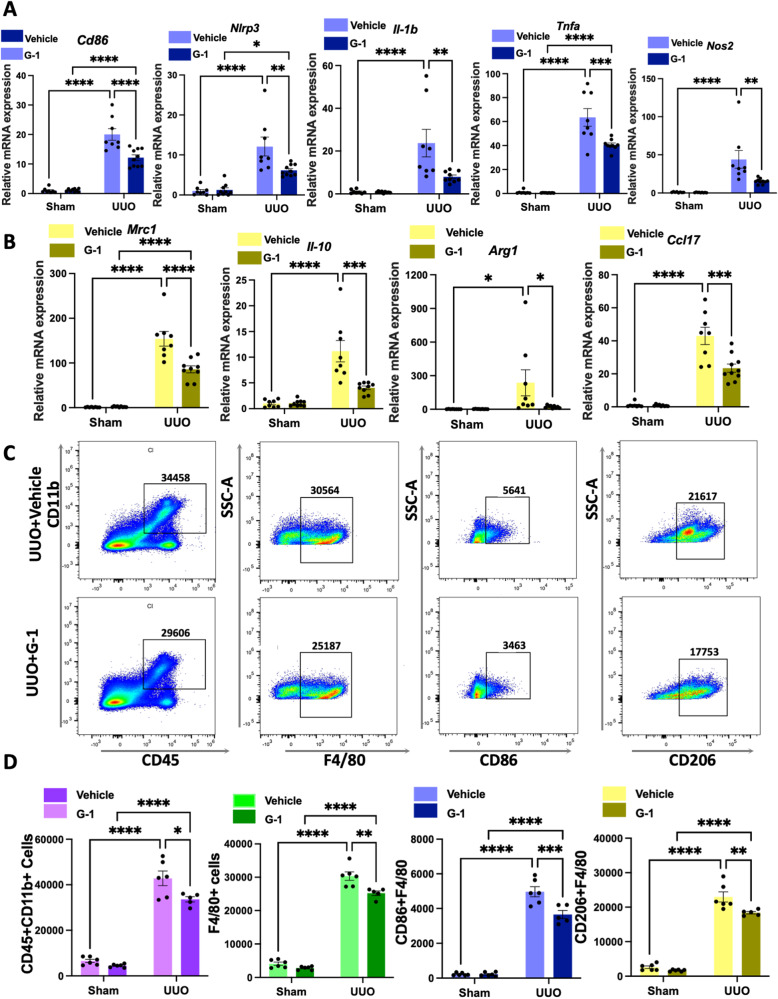
Fig. 4. GPER1 attenuates M1 and M2 macrophage infiltration in the kidneys of OVX mice.
A Relative mRNA expression of M1 macrophage-associated proinflammatory genes Cd86, Nlrp3, Il-1b, Tnf-a, and Nos2 of the sham or obstructed kidney samples of OVX mice treated with or without G-1 (n = 8 in the Vehicle-treated group, n = 9 in the G-1-treated group). B Relative mRNA expression of M2 macrophage-associated genes Mrc1, Il-10, Arg-1, and Ccl17 of the sham or obstructed kidney samples of mice treated with or without G-1 (n = 8 in the Vehicle-treated group, n = 9 in the G-1-treated group). C Representative flow cytometry dot plots of the expression of macrophages in kidneys from UUO OVX female mice with or without G-1 treatment. D Representative flow cytometric data and analysis of the counts of myeloid cells (CD45 + CD11b+), total macrophages (F4/80+), M1 macrophages (F4/80+, CD86+), M2 macrophages (F4/80+, CD206+) (n = 6 in the Vehicle-treated group, n = 5 in the G-1-treated group). Data are shown as means ± SEM. Two-way ANOVA with Tukey’s test. *P < 0.05,**P < 0.01, ***P < 0.001, ****P < 0.0001.

