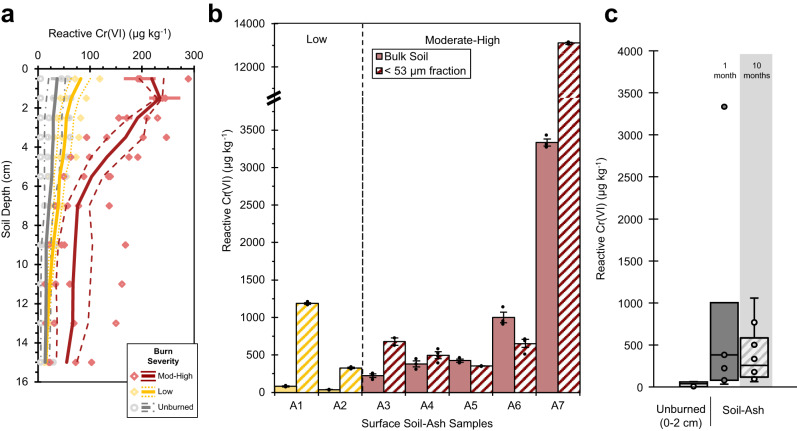
Fig. 3. Effect of fire severity on Cr(VI) formation and persistence in soil and ash.
a Average reactive Cr(VI) concentrations (µg kg-1) within soil profiles (0−16 cm) that were not burned (gray, n = 3), experienced low (yellow; n = 3) or moderate-high burn severity (red; n = 4) in a serpentine chaparral landscape. Points (gray circles, unburned; yellow diamonds, low severity; red diamonds, moderate-high severity) are reactive Cr(VI) concentrations for each soil core based on triplicate measurements (error bars represent standard error). Solid and dashed lines respectively represent the mean (based on n soil cores) and standard error of the means. b Average reactive Cr(VI) concentrations (µg kg−1) from bulk surface soil and ash layers (<2 mm; solid) and the sieved fraction of silt and clay-sized particles (<53 µm; striped) collected in low (yellow) and moderate-high (red) burn severity locations. Error bars represent standard error of the mean and points are individual replicates. The y-axis is hatched to include reactive Cr(VI) concentration measured in the <53-µm size fraction of A7. c Box and whisker plot of reactive Cr(VI) concentrations (µg kg-1) within the surface (0−2 cm) of unburned serpentine soil (n = 6) and from bulk surface ash layers collected in low and moderate-high burn severity locations 1-month post-fire (September 2020, n = 7) and 10 months post-fire (July 2021, n = 10). The center line is the median, the box spans the interquartile range, the whiskers are 1.5x interquartile range, and the points represent individual samples, including outliers.

