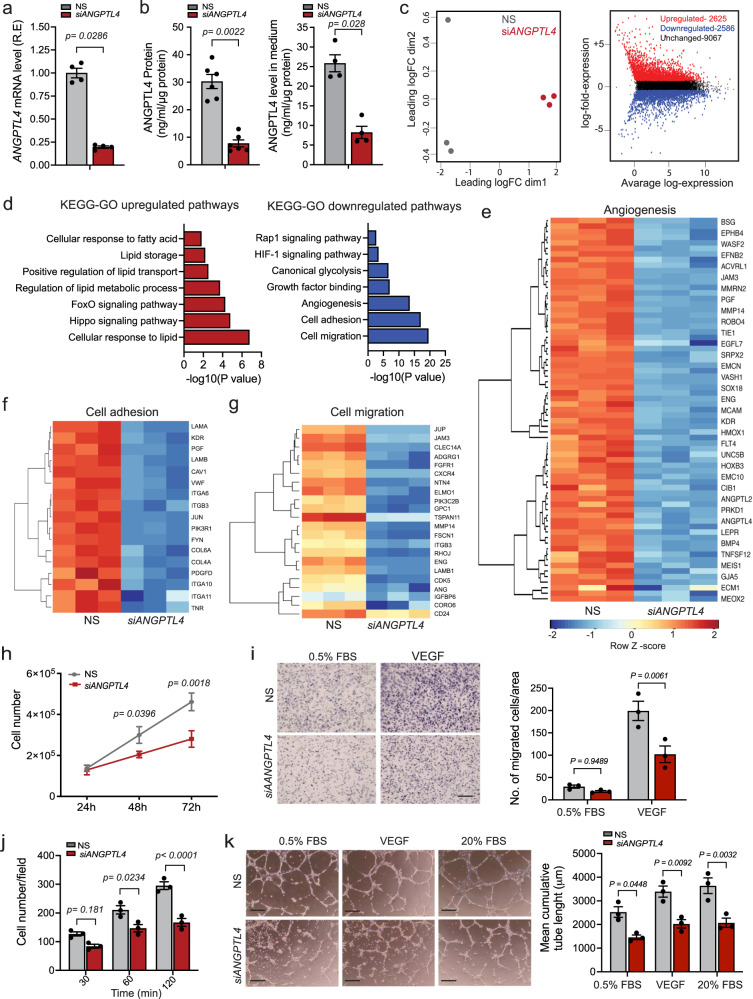
Fig. 1. Endothelial ANGPTL4 regulates EC Angiogenic Functions.
HUVECs were transfected for 6 h with siRNA against ANGPTL4 or NS control, cells and/or media were harvested 60 h post-transfection unless otherwise indicated. a qRT-PCR analysis showing the expression of ANGPTL4 (n = 4 independent experiments). b ELISA analysis of intracellular (left panel) and secreted (right panel) levels of ANGPTL4. (a, left panel, n = 6 and right panel n = 4 independent experiments). c–g, RNAseq analysis (n = 3 biological replicates). c MDS plot shows distinct clustering of the NS and siANGPTL4 samples (left panel). MD plot (right panel) showing the log-fold change and average abundance of each gene. Significantly altered genes (Fold change >1.5) of upregulated (2625 genes) and downregulated genes (2586) in ANGPTL4 silenced HUVECs. d KEGG-GO pathway analysis of differentially upregulated (red bars) and downregulated (blue bars) genes in siANGPTL4 vs NS (significance for DGE was determined with Limma’s decideTests). e–g Heatmaps of transcript levels of angiogenesis, cell adhesion, and cell migration pathway genes. Color key: red-high correlation; blue- low correlation. h Proliferation, alive cells were counted at the indicated time points post transfection (n = 3 independent experiments performed in duplicate). i 60 h post-transfection, migration in basal (0.5%) FBS or in response to VEGF tested by Transwell cell Migration assay. Representative micrographs of migrated cells (left panel). Right panel, quantitation of number of cells migrated per area. j, Cell adhesion on gelatin-coated glass plates at the indicated time points, with cells harvested 60 h post-transfection. k, Matrigel cord formation assay. Cells were counted and seeded on a Growth Factor Reduced Matrigel in the presence of 0.5% FBS (basal; left panels), 0.5% FBS + VEGF (VEGF stimulated; middle panels) and 20% FBS (serum-stimulated; right panels). Cumulative sprout length of capillary-like structures measured by light microscopy after 8 h. Representative micrographs and quantification of cumulative tube lengths are shown. (i–k, n = 3 independent experiments). Scale bars, 75μm (i), 50μm (k). Data are represented as means ± SEM. Mann–Whitney U test in (a and b), and Two-way ANOVA with Tukey’s multiple comparisons test in (h–k). Exact p values are shown for each comparison. Source data are provided as a Source data file.

