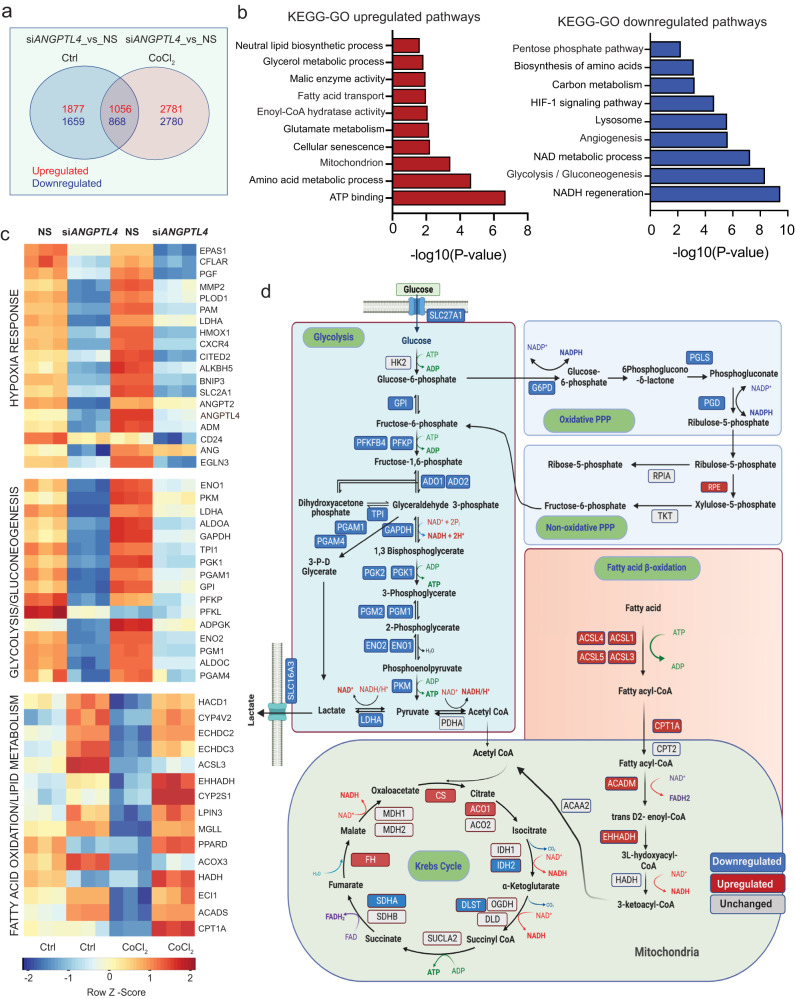
Fig. 3. Metabolic genes signature in HUVECs upon silencing ANGPTL4 in the presence and absence of hypoxia mimetic CoCl2.
HUVECs were transfected for 6 h with siRNA against ANGPTL4 or NS control and then treated with CoCl2 or vehicle control, cells were harvested 60 h post-transfection for RNA-seq analysis (n = 3 biological replicates). a Venn diagram showing the differentially expressed common genes between siANGPTL4 and NS treated with or without hypoxia mimetic CoCl2. b KEGG-GO pathway analysis of 1056 differentially and significantly upregulated (red bars) and 868 downregulated (blue bars) genes in siANGPTL4 vs NS treated with CoCl2 (significance for DGE was determined with Limma’s decideTests). c Heatmap representing the transcript levels of indicated pathway genes. Color key: red, high correlation; blue, low correlation. d Pathway map representing changes in transcript levels of genes in central carbon metabolism in siANGPTL4 vs NS treated with CoCl2. Color key: red, upregulated genes; blue: downregulated, gray: unchanged. Exact p values are shown for each comparison. Source data are provided as a Source data file.

