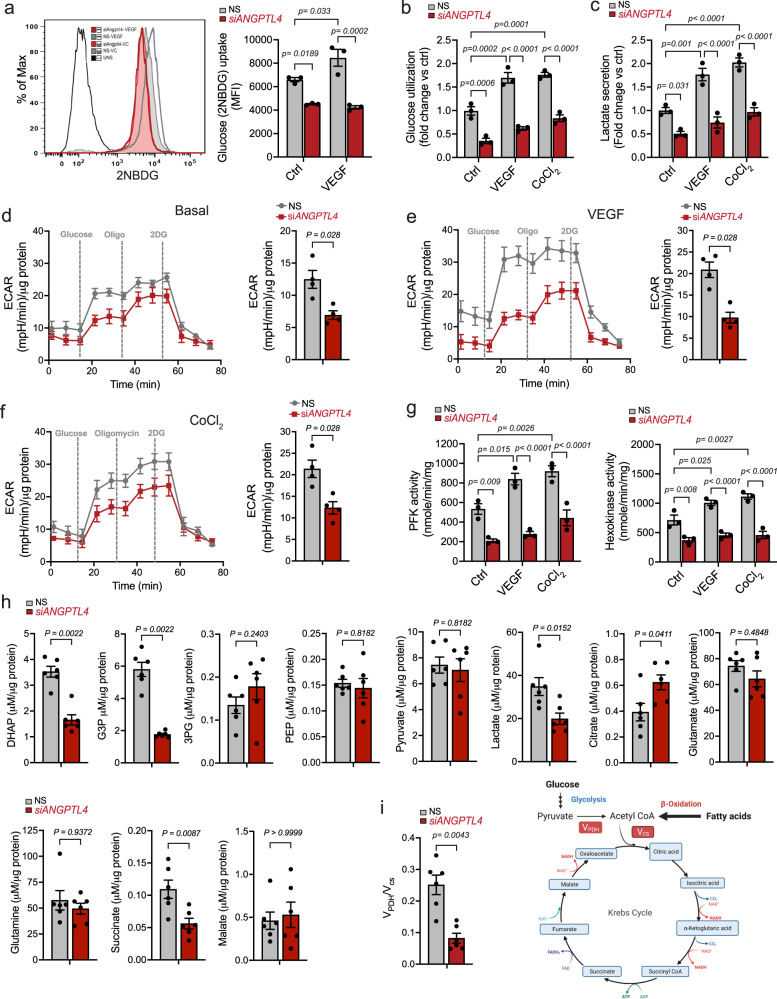
Fig. 4. ANGPTL4 regulates EC glucose metabolism.
a–c HUVECs were transfected for 6 h with siRNA against ANGPTL4 or NS control and then treated with VEGF, CoCl2 or vehicle control as indicated, cells were harvested 60 h post-transfection. a Glucose uptake determined by mean fluorescence intensity of 2NBDG via flow cytometry. b Glucose utilization determined as glucose remaining in the media after indicated incubation conditions. c Lactate secretion determined by measuring its levels in the media in indicated conditions. a–c (n = 3 independent experiments). d–f Seahorse analysis of glycolysis. HUVECs were transfected as described above. 48 h post-transfection, they were replated on Seahorse plates, incubated in basal media containing BSA (d), treated with VEGF (e) or CoCl2 (f) for 24 h. Bar graphs on the left shows quantification of glycolysis rate (n = 4 independent experiment). g Activity of PFK and HK. Cells were incubated as in a–c. (n = 3 independent experiments performed in duplicate). h, i HUVECs were transfected as above, and cells were harvested 60 h post-transfection. h Steady-state levels of glycolysis and TCA cycle metabolites (Raw data are in Supplemental data 1). i MIMOSA analysis of metabolic flux through PDH and CS. Right panel shows the preference of substrate in the TCA cycle based on VPDH/VCS data shown in left panel. h, i (n = 6 biological replicates). Data are represented as means ± SEM. Mann–Whitney U test in (d–f, h, i) and Two-way ANOVA with Tukey’s multiple comparisons test in (a–c, g). Exact p values are shown for each comparison. Source data are provided as a Source data file.

