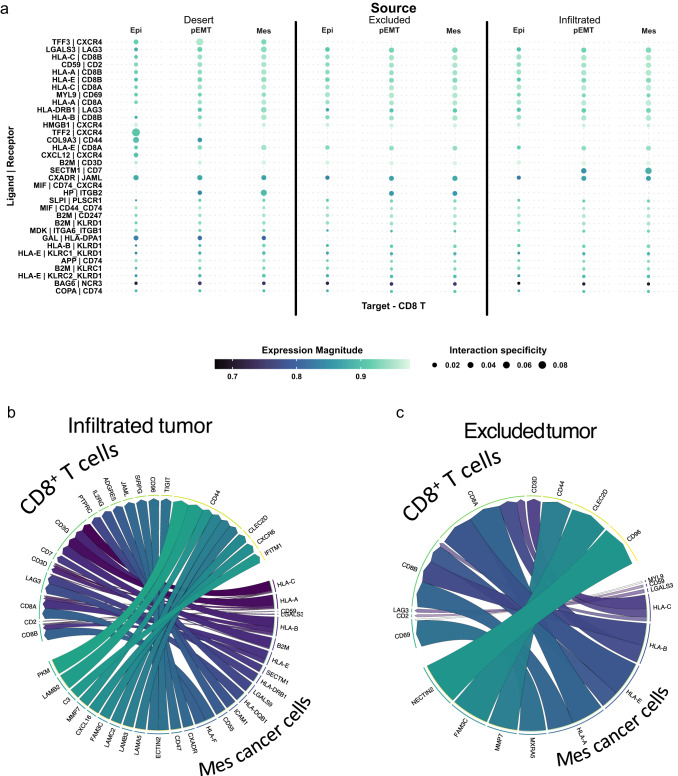
Fig. 4. Most ligands targeting CD8+ T-cells in the TME originate from the mesenchymal cancer cells.
a Cell-cell communication analysis of top-most ligand-receptor pairs from cancer cells from 16 HGSOC samples arrayed by infiltration phenotype of tumors and EMT to CD8+ T-cells. ‘Expression magnitude’ is a measure of expression levels of a certain interaction. ‘Specificity’ is a measure of the specificity of interactions across all cell types. Interactions are ordered by p-value where top-most receptor-ligand pair has lowest p-value. Circle plot of ligands originating from mesenchymal cancer cells in infiltrated tumors (b) and excluded tumors (c), and the receptors targeted on recipient CD8+ T-cells. Order and color of ligands corresponds to p-value aggregate rank reflecting specificity of interactions (most specific – purple color, clockwise). The number of tracks per ligand corresponds to the number of overall interactions the ligand has with different receptors. Track width corresponds to p-value aggregate rank within a ligand if the ligand has multiple receptor targets.

