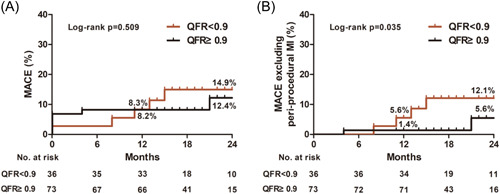
Figure 2.

Kaplan–Meier time‐to‐event curve for MACE (A) and for MACE excluding peri‐procedural myocardial infarction (B) according to postpercutaneous coronary intervention QFR cut‐off value (0.9). MACE, major adverse cardiovascular events; MI, myocardial infarction; QFR, quantitative flow ratio.
