Figure 2.

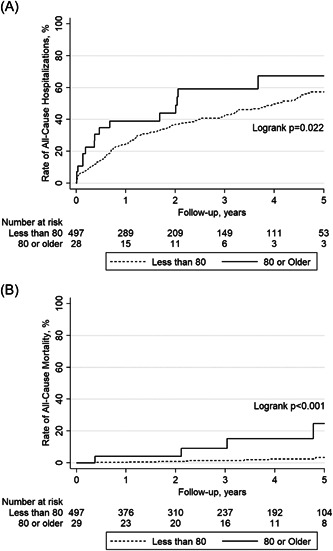
Kaplan–Meier plots of (A) long‐term rate of all‐cause hospitalizations and (B) long‐term rate of all‐cause mortality. Patients who were 80 years of age or older and a younger cohort are compared.

Kaplan–Meier plots of (A) long‐term rate of all‐cause hospitalizations and (B) long‐term rate of all‐cause mortality. Patients who were 80 years of age or older and a younger cohort are compared.