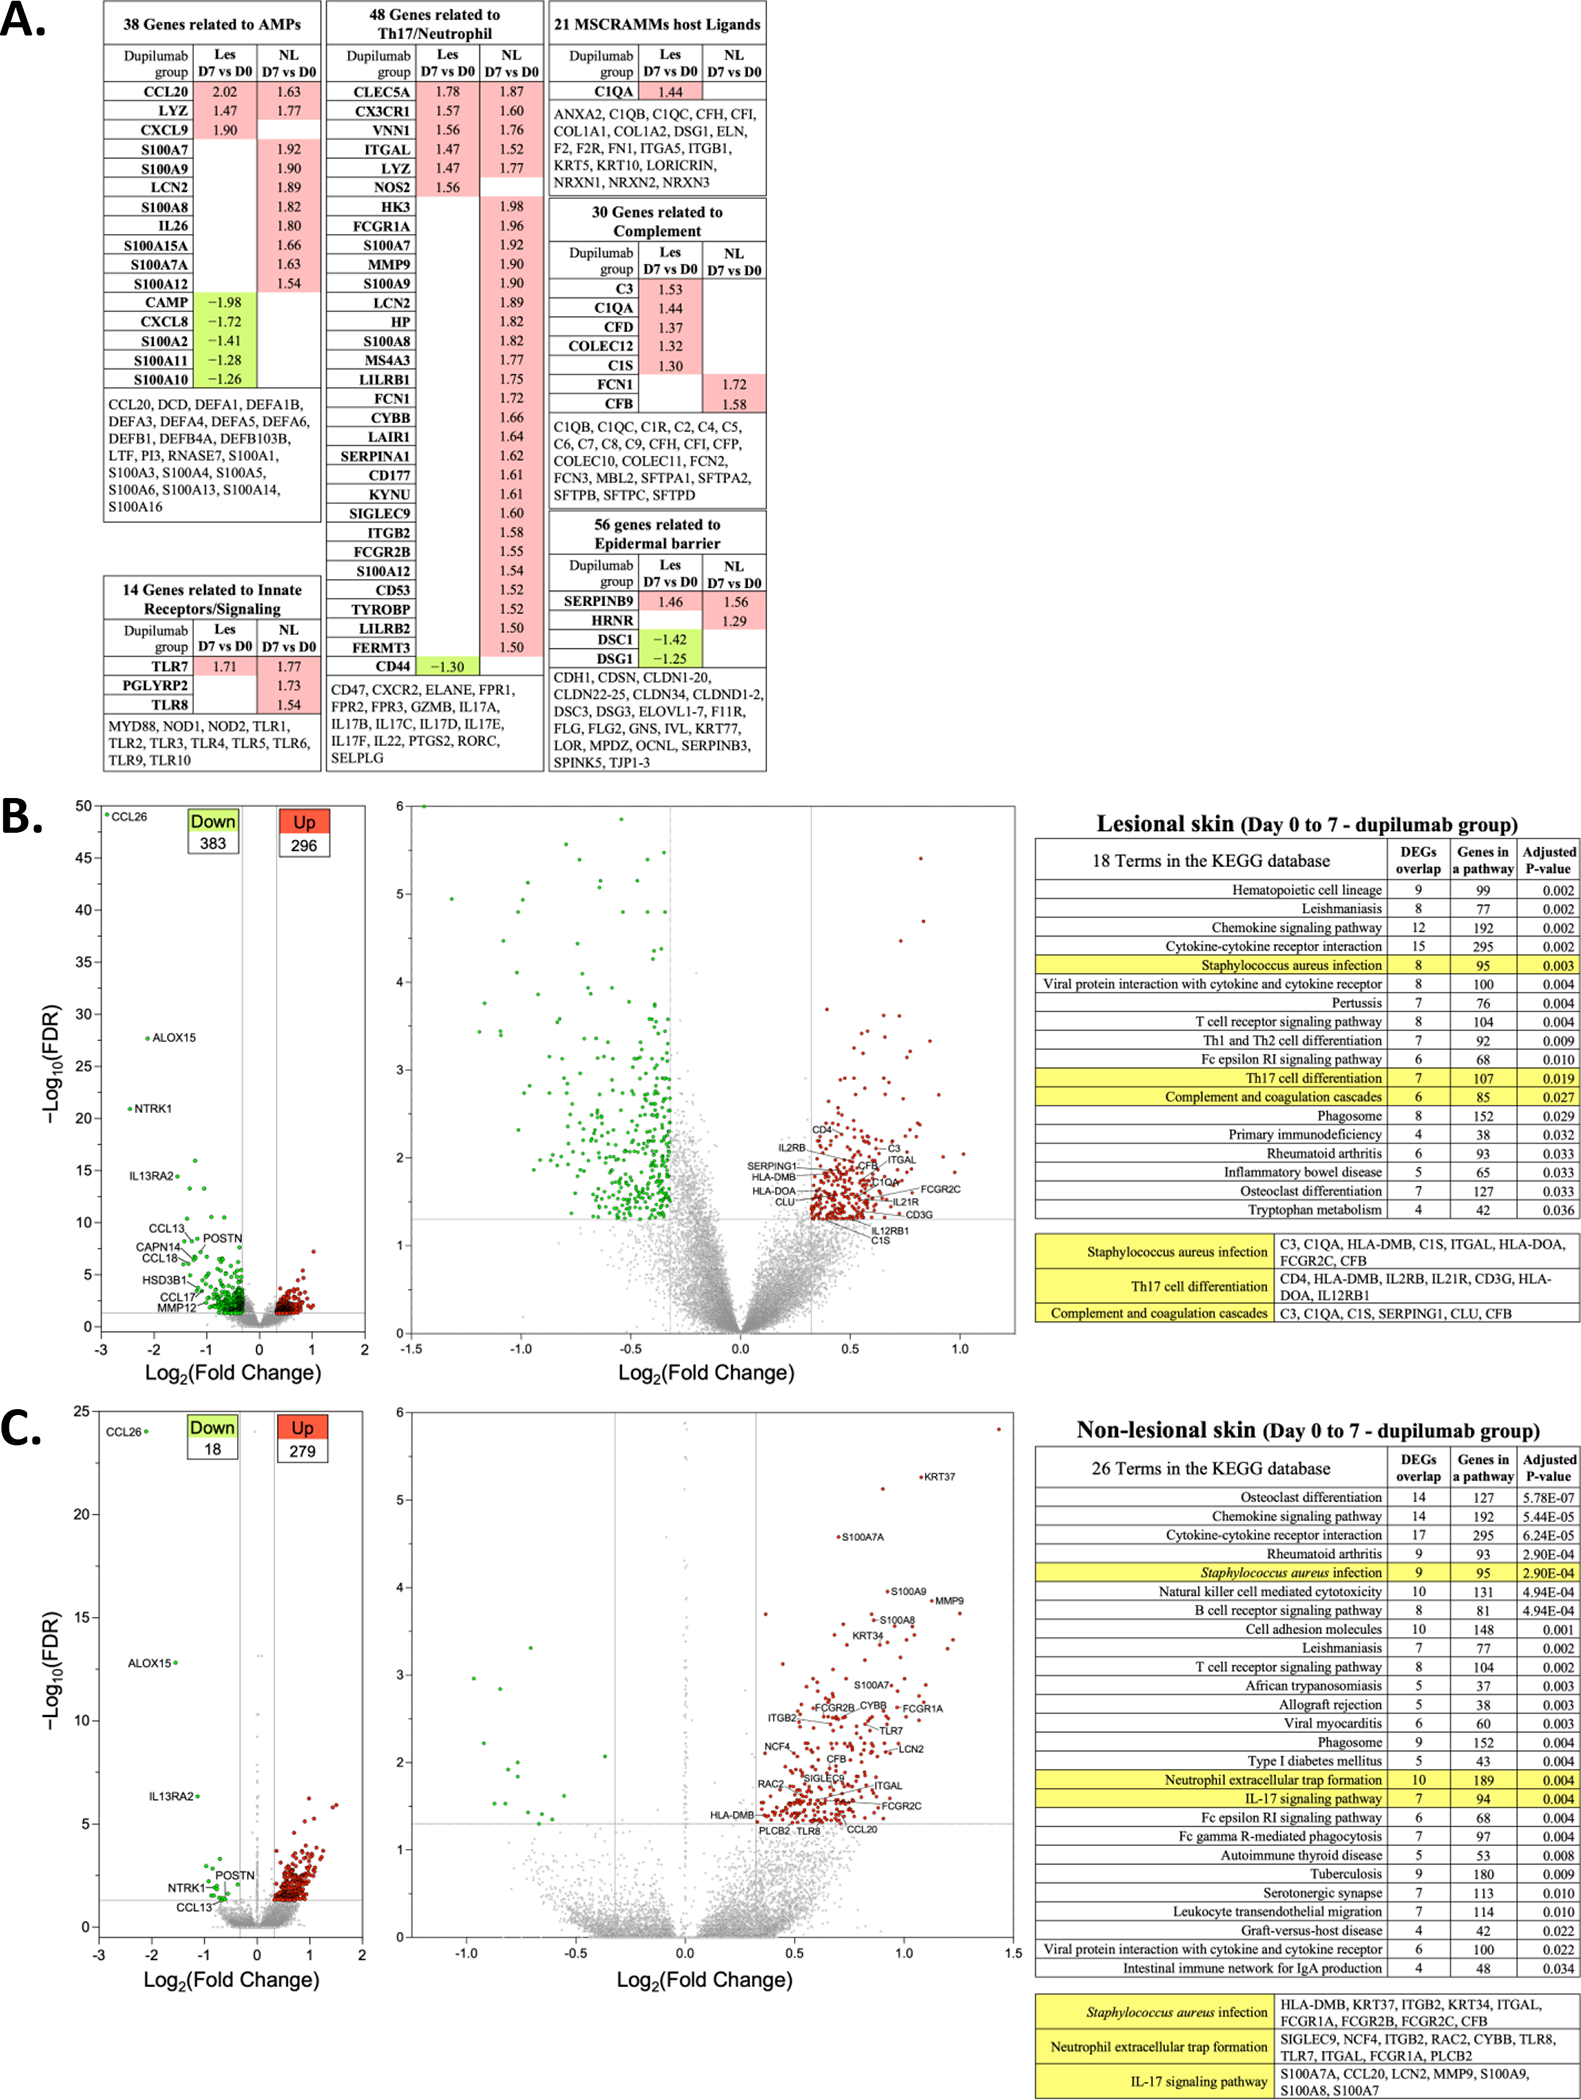
Figure 6. Transcriptomics changes in lesional and non-lesional skin in response to dupilumab treatment.

(A) DEGs with FDR of <0.05 and a log FC >1.25 in les and NL skin are shown. They are separated into functional groups: antimicrobial proteins (AMPs), Innate Receptors/Signaling, Th17/Neutrophil, microbial surface components recognizing adhesive matrix molecules (MSCRAMMs), complement and epidermal barrier. The genes listed at the bottom of each of these are those that are not significantly altered in their expression. (B) Volcano plot showing increased (n=296) or decreased (n=383) DEG from lesional skin of dupilumab treated subjects (Day 7 vs Day 0). The graphs show log2 FC in gene expression of lesional skin (Day 7) over lesional skin (Day 0) plotted against negative log10 FDR. (C) Volcano plot showing upregulated (n=279) or downregulated (n=18) DEGs from non-lesional skin of dupilumab treated subjects (Day 7 vs Day 0). Genes represented in red are upregulated by >1.25-fold in Day 7 lesional or non-lesional skin (FDR < 0.05). Genes represented in green are downregulated by >1.25-fold in Day 7 lesional or non-lesional skin (FDR < 0.05). The left most volcano plot is all of the DEG and the right most volcano plot reduces the y axis to enable labelling of some of the upregulated DEGs. The table lists the KEGG pathways with a few highlighted in yellow because of their potential relevance to dupilumab-induced S. aureus reductions. We list the DEGs in these pathways that are dysregulated in our samples. DEG, differentially expressed genes; FDR, false discovery rate; les, lesional skin; NL, nonlesional skin; KEGG, Kyoto Encyclopedia of Genes and Genomes
