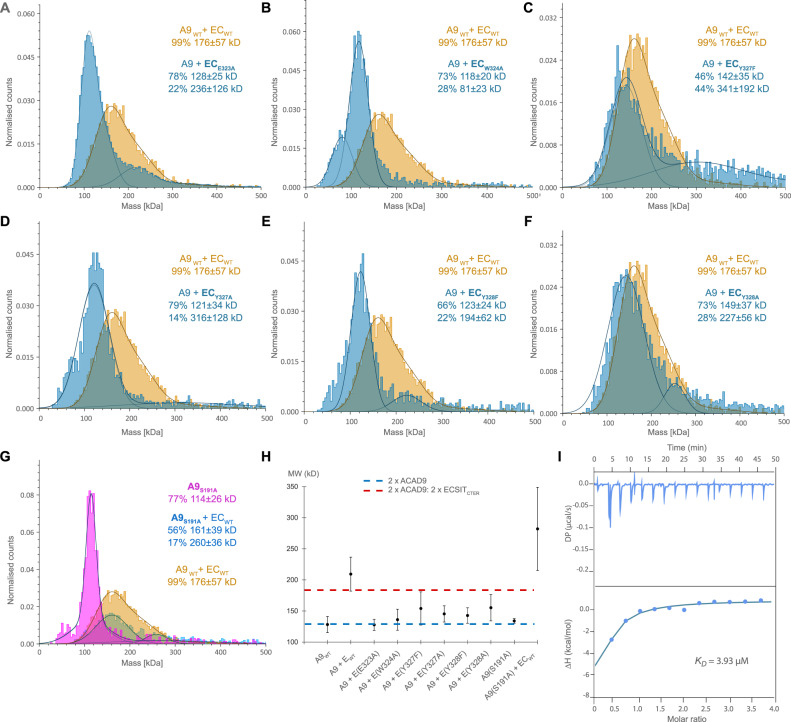
Fig. 2. Analysis of interface derived mutants on ACAD9WT-ECSIT complex formation.
Several mutants were designed to probe the complex interface and identify the role of the residues in complex formation. The mutant species were reconstituted with the corresponding WT protein and compared with ACAD9WT-ECSITCTER. A Mass photometry assays show that ECSITCTER-E323A severely impacts the formation of the complex, with no MW corresponding to ACAD9-ECSITCTER-E323A observed. B ECSITCTER-W324A negatively impacts complex formation, with the MW of the main species similar to ACAD9WT. C ECSITCTER-Y327F complexes with ACAD9WT but also forms higher order species. D ECSITCTER-Y327A affects complex formation similarly to (B). E ECSITCTER-Y328F has a detrimental effect on complex formation as (B) and (D) whereas (F) ECSITCTER-Y328Aforms the complex, however, with additional higher MW species. G ACAD9S191A appears a more stable dimer than ACAD9WT (Supplementary Fig. 1B) and forms an ACAD9S191A-ECSITCTER complex. Experiments were repeated thrice with similar results. H DLS assays show that all ECSIT mutants show a reduced average MW (130–150 kDa) in comparison to the ACAD9WT-ECSITCTER complex, indicating partial complex formation but a reduction in stability. ACAD9S191A has a MW very similar to ACAD9WT, however, in complex with ECSITCTER, there is the formation of higher MW species. Blue and red dashed lines indicate the expected MW for ACAD9WT- homodimer and ACAD9WT-ECSITCTER complex, respectively. Data are presented as mean values ± SD of at least n = 3 biological replicas. I ITC binding assay for the binding affinity between ACAD9S191A and ECSITCTER. The equilibrium dissociation constant (KD) of the ACAD9S191A-ECSITCTER complex is 3.93 μM, ~3-fold lower than that of ACAD9WT-ECSITCTER (Supplementary Fig. 2A). The experiment was repeated thrice with similar results. Source data are provided as a Source Data file.

