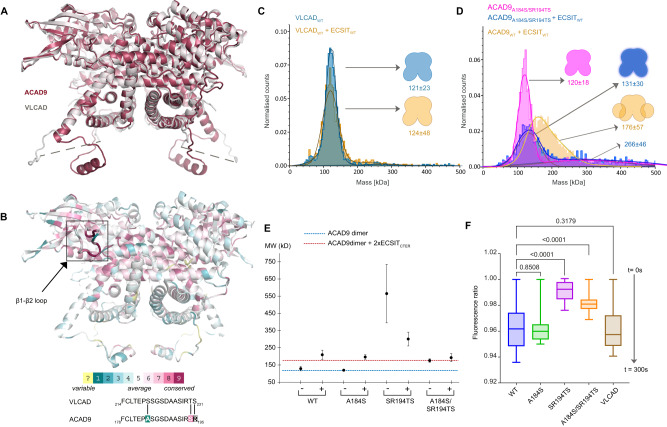
Fig. 4. The FAD-gatekeeper loop stabilises the ACAD dimeric conformation but does not determine ECSIT binding.
A Superposition of VLCAD crystal structure (7S7G) and the ACAD9S191A cryo-EM structure. B Representation of ACAD9 structure based on the evolutionary conserved residues estimated by the ConSurf prediction software20. Aligned sequences of the ACAD9 and VLCAD FAD-gatekeeper loop. Mutated residues are shown in bold. C VLCADWT is a very stable dimer (blue) and does not form a complex when reconstituted with ECSITCTER (orange). D ACAD9A184S/SR194TS primarily forms a dimer (pink) although it also forms higher order species upon reconstitution with ECSITCTER (blue), indicating a decrease in the stability of the complex, while retaining the ability to bind to ECSIT. Experiments were repeated thrice with similar results. E DLS measurements of ACAD9 mutants designed to mimic the VLCAD loop. The ACAD9A184S mutant exhibits similar behaviour to ACAD9WT. The double mutant ACAD9SR194TS is destabilised, although the effect was less profound in complex with ECSITCTER; some complex is formed but at higher MW than ACAD9WT-ECSITCTER. In contrast, the double mutant ACAD9A184S/SR194TS shows no change in MW before and after reconstitution with ECSITCTER, however, we can attribute this to a reduction in protein stability while retaining the ability to bind ECSITCTER. Blue and red dashed lines indicate the expected MW for ACAD9WT homodimer and ACAD9WT-ECSITCTER complex, respectively. Data are presented as mean values ± SD of at least n = 3 biological replicas. F Acyl-CoA dehydrogenase (ACAD) activity of ACAD9WT, ACAD9 mutants, and VLCAD determined by an ETF fluorescence reduction assay. After addition of the ACAD specific substrate palmitoyl-CoA (C16:0), there is a clear loss of ETF fluorescence in ACAD9WT, ACAD9A184S and VLCAD in comparison to the other ACAD9 mutants, over 300 s of reaction measurement. Data are presented as box-whisker plots with median quartiles and from minimum to maximum values, at least n = 3 biological replicas. Statistical significance was calculated with an RM-one way ANOVA with Dunnett’s multiple comparisons test relative to ACAD9. p values are indicated (non-significant p = 0.8508, p = 0.3179; ****p ≤ 0.0001). Source data are provided as a Source Data file.

