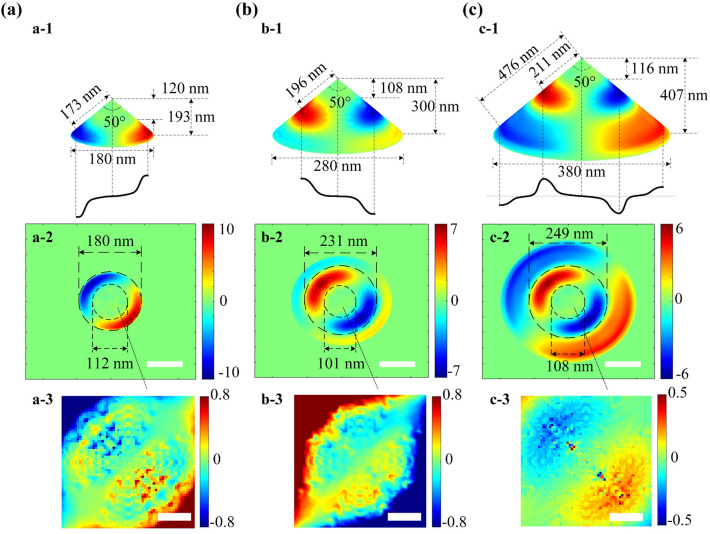
Figure 2.
Typical net-charge instantaneous distribution over the surface of a single NOA with the same top angle of 50° but different bottom diameter d: (a) 180 nm, (b) 280 nm, and (c) 380 nm. The 3D simulations are shown in (a-1) to (c-1), where the key structural parameters about the main DNCS based on the standing wave mode having the same apex node and the featured schematic waveform are also given. The top views of the net-charge distribution corresponding to a pixel area of 500 nm × 500 nm are exhibited in (a-2) to (c-2) (scalar bar 100 nm), where the upper and lower boundary circles of the main DNCS are indicated by both the long and short dashed circles, respectively. The enlarged viewings of the patterned net-charge over the apex region sized in 100 nm × 100 nm are shown in (a-3) to (c-3) (scalar bar 30 nm).

