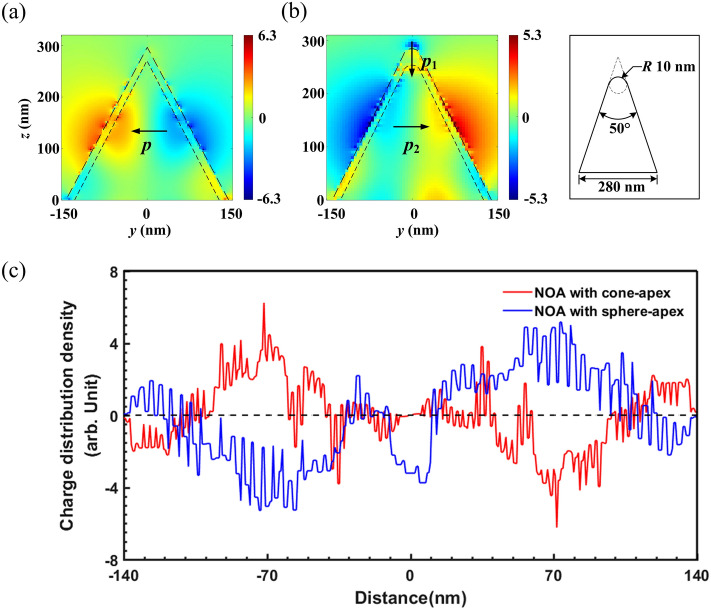
Figure 5.
Comparison about the net-charge arrangement characters over the NOAs with different apex-appearance but the same lower frustum, whose top and bottom radius are 10 nm and 140 nm, respectively. The cross-sectional net-charge distribution density of the NOAs with (a) cone-apex and (b) sphere-apex in the y–z plane are also given, and a typical structure of the latter is displayed in the inset. The contour of the Au-NOA and the silicon NOA are also plotted along a long and a short dashed-line, respectively. (c) The net-charge distribution density over the surface of the NOAs with a cone-apex (blue line) and a sphere-apex (red line).

