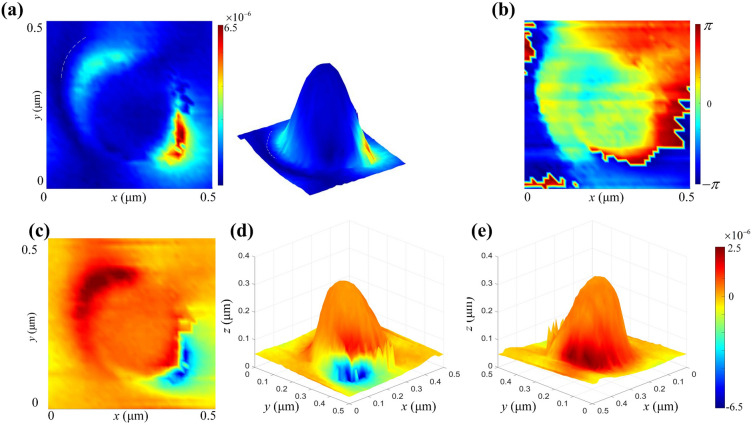
Figure 8.
Microband-shaped near-field lightwave distribution over a single NOA obtained by SNOM measurement and the correlated surface net-charge instantaneous distribution reconstructed. (a) The top viewing and 3D presentation of the amplitude S7; (b) the top viewing of the phase φ7; (c) the top viewing of an instantaneous dipole net-charge distribution; (d) the 3D viewing of an instantaneous negative net-charge distribution illuminated by SNOM beams; (e) the 3D viewing of an instantaneous positive net-charge distribution.

