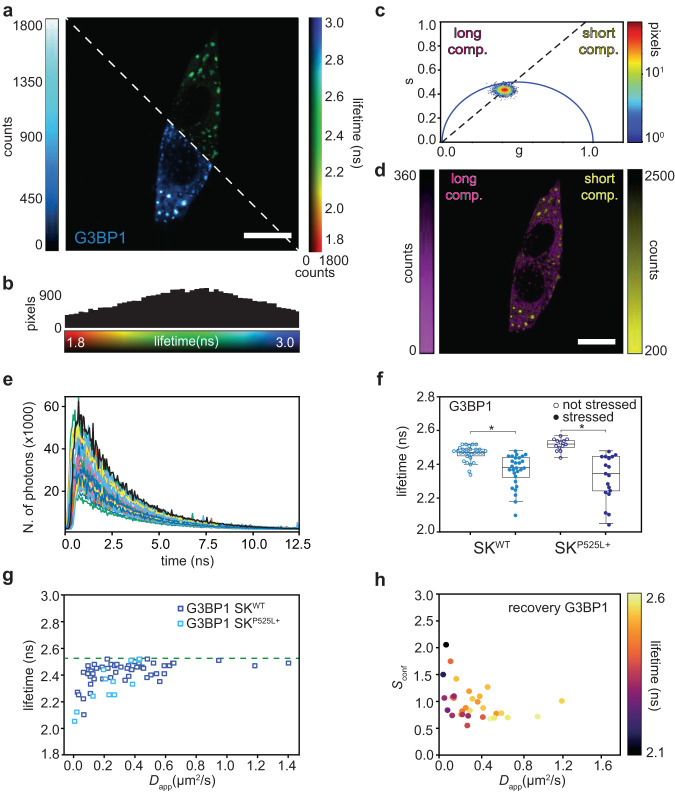
Fig. 4. Fluorescence lifetime fluctuation spectroscopy.
a SK-N-BE WT cell expressing G3BP1-eGFP under oxidative stress. Bottom-left ISM reconstructed intensity-based image, and top-right ISM reconstructed fluorescence lifetime-based image. Scale bar 10 μm. b Histogram of the fluorescence lifetime values of the image in (a). c Pixel intensity thresholded phasor plots. Number of pixels versus the polar coordinate (10% thresholds) of the image shown in (a). d Phasor-based segmentation. ISM intensity images were obtained by back projecting the points on the left of the phasor centroid (dotted line), representing pixels of the image with a long lifetime, and the points on the right of the phasor centroid, representing pixels of the image with a short lifetime. Scale bar 10 μm. e Time decay histograms for the different SPAD array detector pixels, central pixel in black. f Box-plots of G3BP1 fluorescence lifetime in SK-N-NE cells WT (left, n = 29 before stress, n = 28 during stress, two independent experiments) and mutated (right, n = 13 before stress, n = 18 during stress, two independent experiments). Empty circles represent measurements in the cytosolic phase before the stress, and full circles represent measurements in the stress granule. In both cases, the fluorescence lifetimes are significantly different when measured in the diluted or in the condensed phase (Welch’s t-test confidence level = 0.95, p value = 3e−6 for WT and p value = 1e−5 for mutated condition). The horizontal line in each box represents the median, the edges are the 25th and 75th percentile, and the vertical line extends to the minimum and maximum data points. g Fluorescence lifetime of G3BP1 in WT cells (dark blue, n = 20) and in the mutated cells (cyan, n = 25) correlated with the apparent diffusion coefficient. The dotted line corresponds to the fluorescence lifetime of free eGFP. h Fluorescence lifetime of G3BP1 in mutated cells correlated with the confinement strength and the diffusion coefficient during a recovery experiment (n = 31). Source data are provided as a Source Data file.

