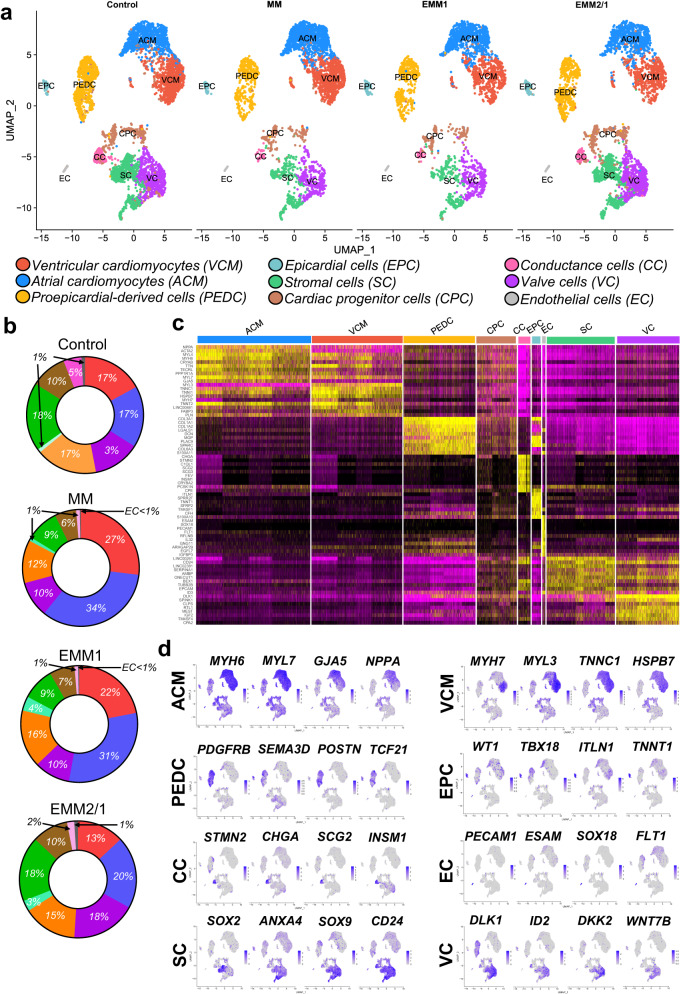
Fig. 2. Single-cell RNA sequencing of human heart organoids reveals distinct cardiac cell populations.
a UMAP dimensional reduction plots of integrated single-cell RNA sequencing data for each condition in day 34 organoids. Cluster identities are in the legend below. b Quantification of total cell count percentages per cluster. Colors of regions correspond to those found in the legend in (a). c Differential expression heatmap displaying the top 10 differentially expressed genes for all clusters. d Feature plots displaying key marker genes for each cluster. Color intensity represents the relative value of gene expression per gene.

