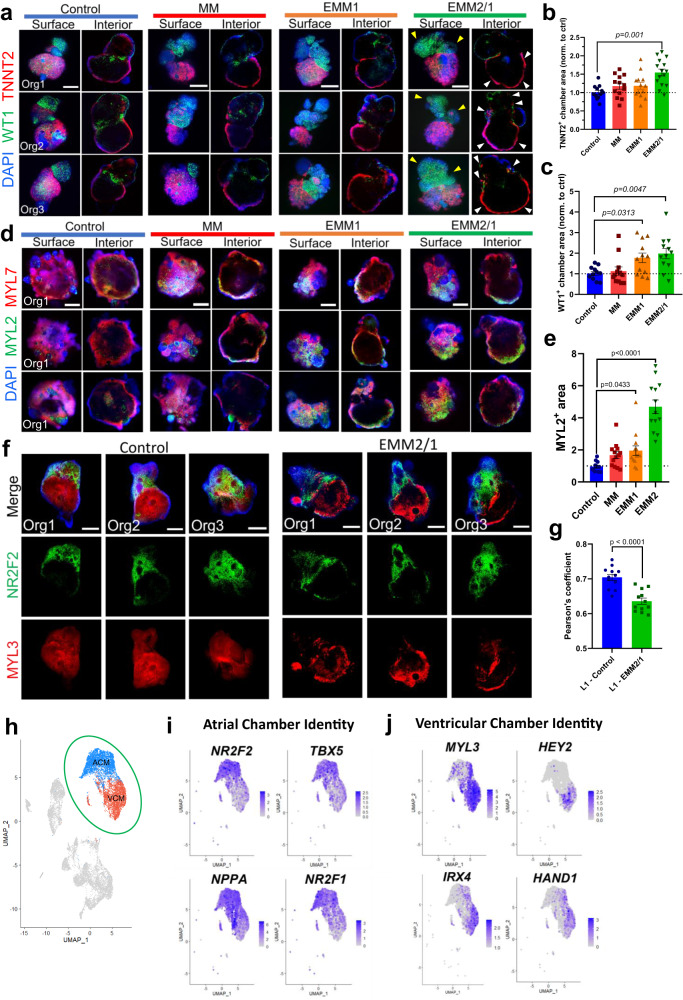
Fig. 6. Developmental induction promotes the emergence of a proepicardial organ and formation of distinct atrial and ventricular chambers by self-organization.
a Representative surface and interior immunofluorescence images of individual day 30 organoids in all conditions displaying WT1 (green), TNNT2 (red), and DAPI (blue). Three organoids are displayed for each condition (n = 12–15 independent organoids per condition across two independent experiments). Yellow arrows represent WT1+ cells on outer surface. White arrows represent TNNT2+ cells on lower chamber wall. Scale bars = 200 m. Quantification of TNNT2+ chamber area (b) and WT1+ chamber area (c) in each condition from images presented in (a) (n = 12, 13, 13, and 15 (b) and n = 12 (c) independent organoids for control, MM, EMM1, and EMM2/1, respectively, across two independent experiments). Values are presented as fold change normalized to control. Values = mean ± s.e.m., one-way ANOVA with Dunnett’s multiple comparisons test. d Representative surface and interior immunofluorescence images of individual day 30 organoids in all conditions displaying MYL2 (green), MYL7 (red), and DAPI (blue). Three organoids are displayed for each condition (n = 13 independent organoids per condition across three independent experiments). Scale bars = 200 μm. e Quantification of MYL2+ area in each organoid in each condition from images presented in (d) (n = 13 independent organoids per condition across three independent experiments). Values are presented as fold change normalized to control. Values = mean ± s.e.m., one-way ANOVA with Dunnett’s multiple comparisons test. f Representative immunofluorescence images of individual day 30 organoids in all conditions displaying atrial marker NR2F2 (green), ventricular marker MYL3 (red), and DAPI (blue). Three organoids are displayed for each condition (n = 12 organoids per condition across two independent experiments). Scale bars = 200 μm. g Quantification of colocalization (Pearson’s coefficient) between NR2F2 (green) and MYL3 (red) from images presented in (f). Values = mean ± s.e.m., unpaired t test. h Feature plot highlighting scRNA-seq VCM and ACM clusters. Feature plots displaying hallmark atrial chamber identity genes (i) and ventricular chamber identity genes (j) that are differentially expressed in the ACM (i) or VCM (j) cluster. Source data are provided as a Source Data file.

