
Figure 3.
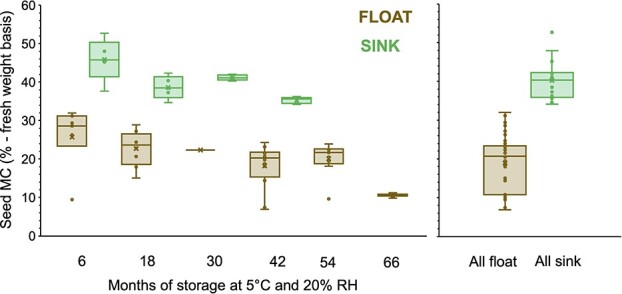
Box and whisker plots of M. fraseri MMC showing the minimum, maximum, median, mean (x) and 25–75% quartile range calculated on a fresh weight basis. Data were derived from assessment of intact seeds that either floated or sank for each of the six storage periods (left graph) or when all storage durations were pooled into two classes, i.e. those that floated or those that sank (right graph).