. 2023 Nov 24;43(12):e230180. doi: 10.1148/rg.230180

Figure 9.

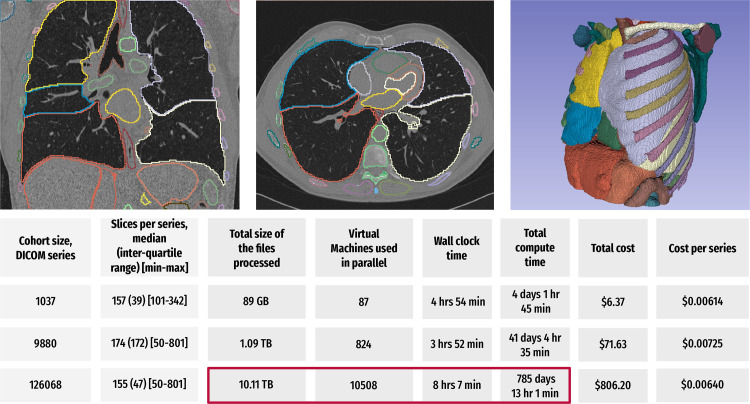
Summary of the results of a preliminary study evaluating the time- and cost-efficient scalable application of the TotalSegmentator algorithm (58) to the IDC NLST collection using CRDC resources. For each of the analyzed cases in the three cohorts of sizes 1037, 9880, and 126 068 in a CT series, the algorithm was used to segment up to 104 anatomic structures (depending on the coverage of the anatomy in a given imaging examination), followed by the extraction of the shape and first-order radiomics features for each of the segmented regions using the pyradiomics library (59). Coronal and axial CT images (top left and center, respectively) and a surface rendering of the segmentations generated using 3D Slicer (https://slicer.org) software (top left) show sample visualizations of the analysis (60). Bottom table summarizes the key parameters and observed performance of the two experiments. The total compute time corresponds to the time needed to perform computation sequentially. In the case of the 126 068 series analysis (red box), scaling of the processing to use 10 508 cloud-based virtual machines in parallel reduced the processing time from the estimated more than 785 days by using a single virtual machine to about 8 hours. The costs are expected to be even lower for the researchers eligible to access the discounts provided by the National Institutes of Health Science and Technology Research Infrastructure for Discovery, Experimentation, and Sustainability (STRIDES) Initiative.

Summary of the results of a preliminary study evaluating the time- and cost-efficient scalable application of the TotalSegmentator algorithm (58) to the IDC NLST collection using CRDC resources. For each of the analyzed cases in the three cohorts of sizes 1037, 9880, and 126 068 in a CT series, the algorithm was used to segment up to 104 anatomic structures (depending on the coverage of the anatomy in a given imaging examination), followed by the extraction of the shape and first-order radiomics features for each of the segmented regions using the pyradiomics library (59). Coronal and axial CT images (top left and center, respectively) and a surface rendering of the segmentations generated using 3D Slicer (https://slicer.org) software (top left) show sample visualizations of the analysis (60). Bottom table summarizes the key parameters and observed performance of the two experiments. The total compute time corresponds to the time needed to perform computation sequentially. In the case of the 126 068 series analysis (red box), scaling of the processing to use 10 508 cloud-based virtual machines in parallel reduced the processing time from the estimated more than 785 days by using a single virtual machine to about 8 hours. The costs are expected to be even lower for the researchers eligible to access the discounts provided by the National Institutes of Health Science and Technology Research Infrastructure for Discovery, Experimentation, and Sustainability (STRIDES) Initiative.