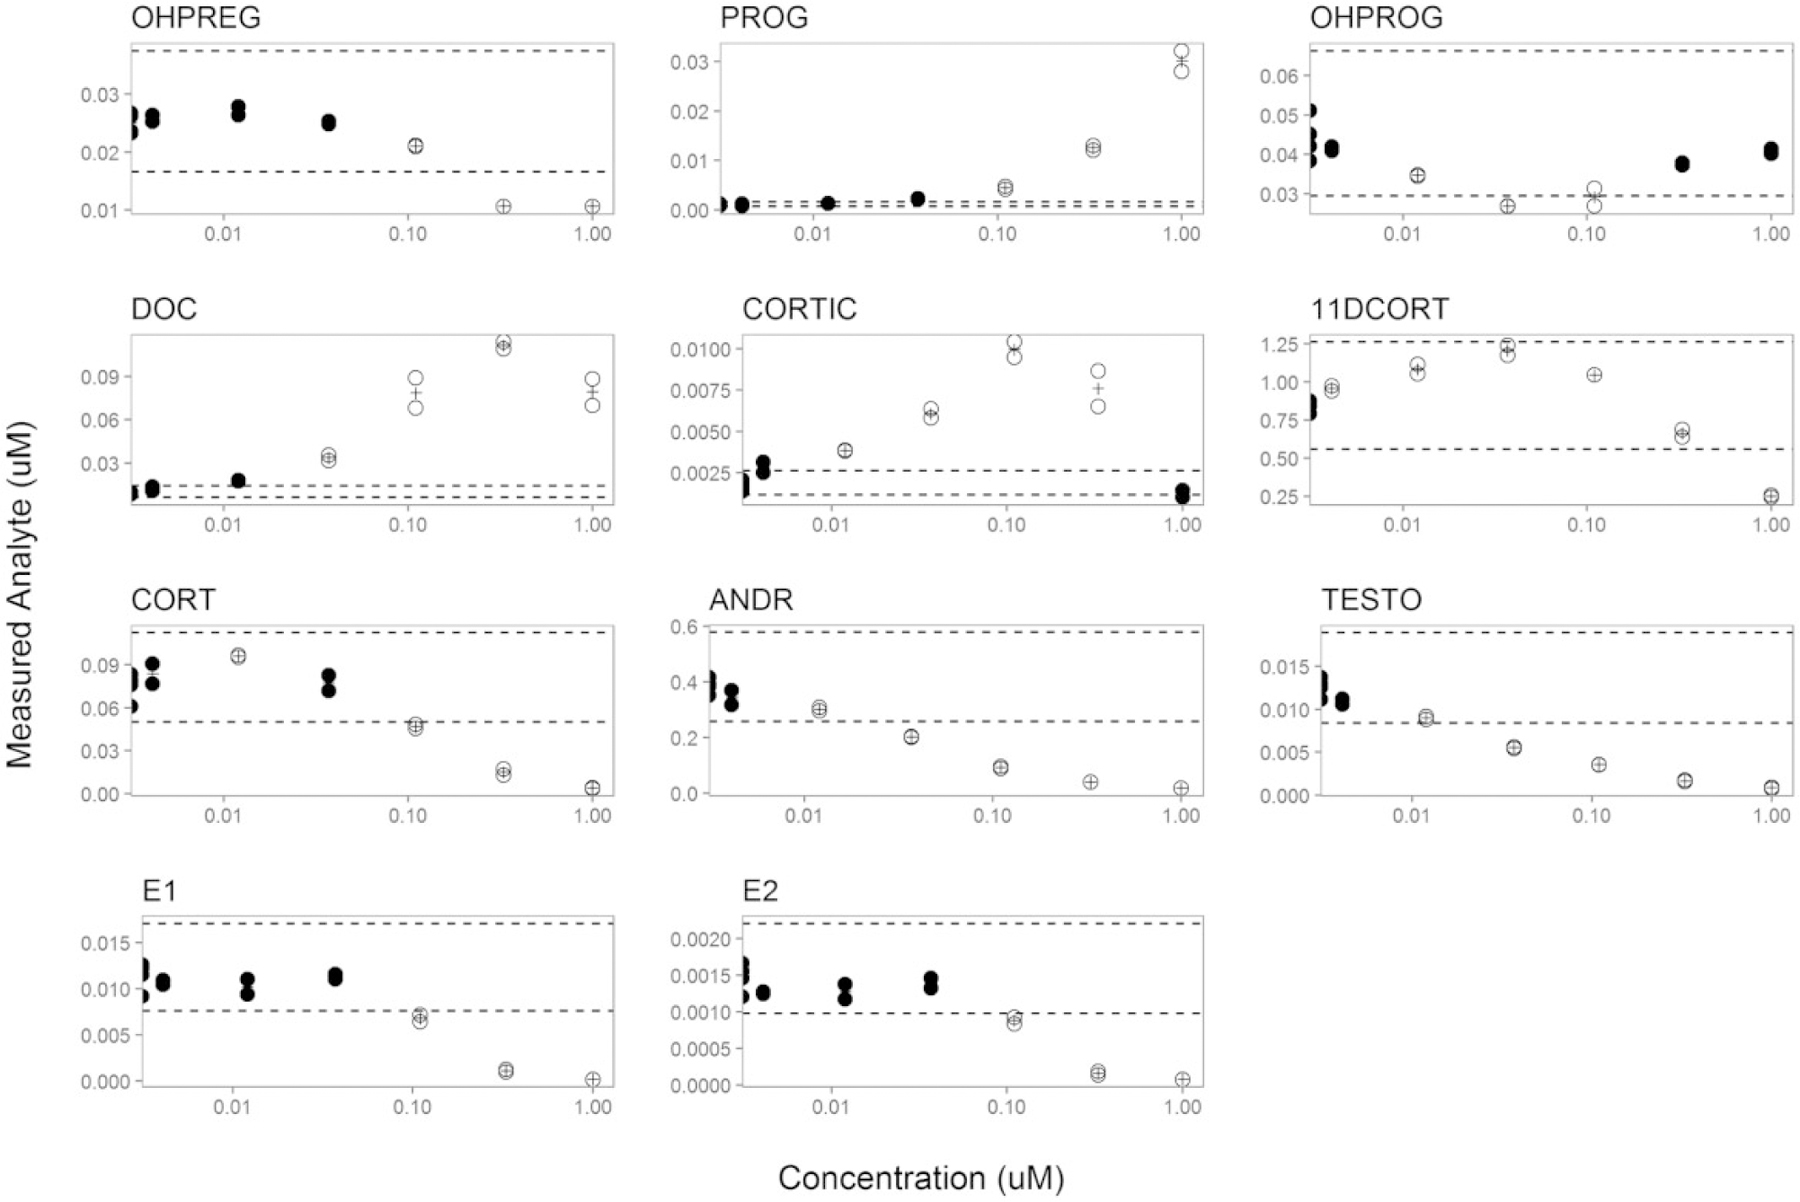
Figure 2.

Example visualization of the ANOVA results for prochloraz. Replicates and the mean response values are denoted as filled circles and plus signs, respectively. Open circles indicate data points that were significantly different from control (p < .05). Dashed horizontal lines indicate 61.5-fold versus DMSO control to give additional context for low magnitude, but positive, responses. Data are plotted as concentration (μM) of prochloraz versus the measured steroid hormone analyte concentration (μM).
