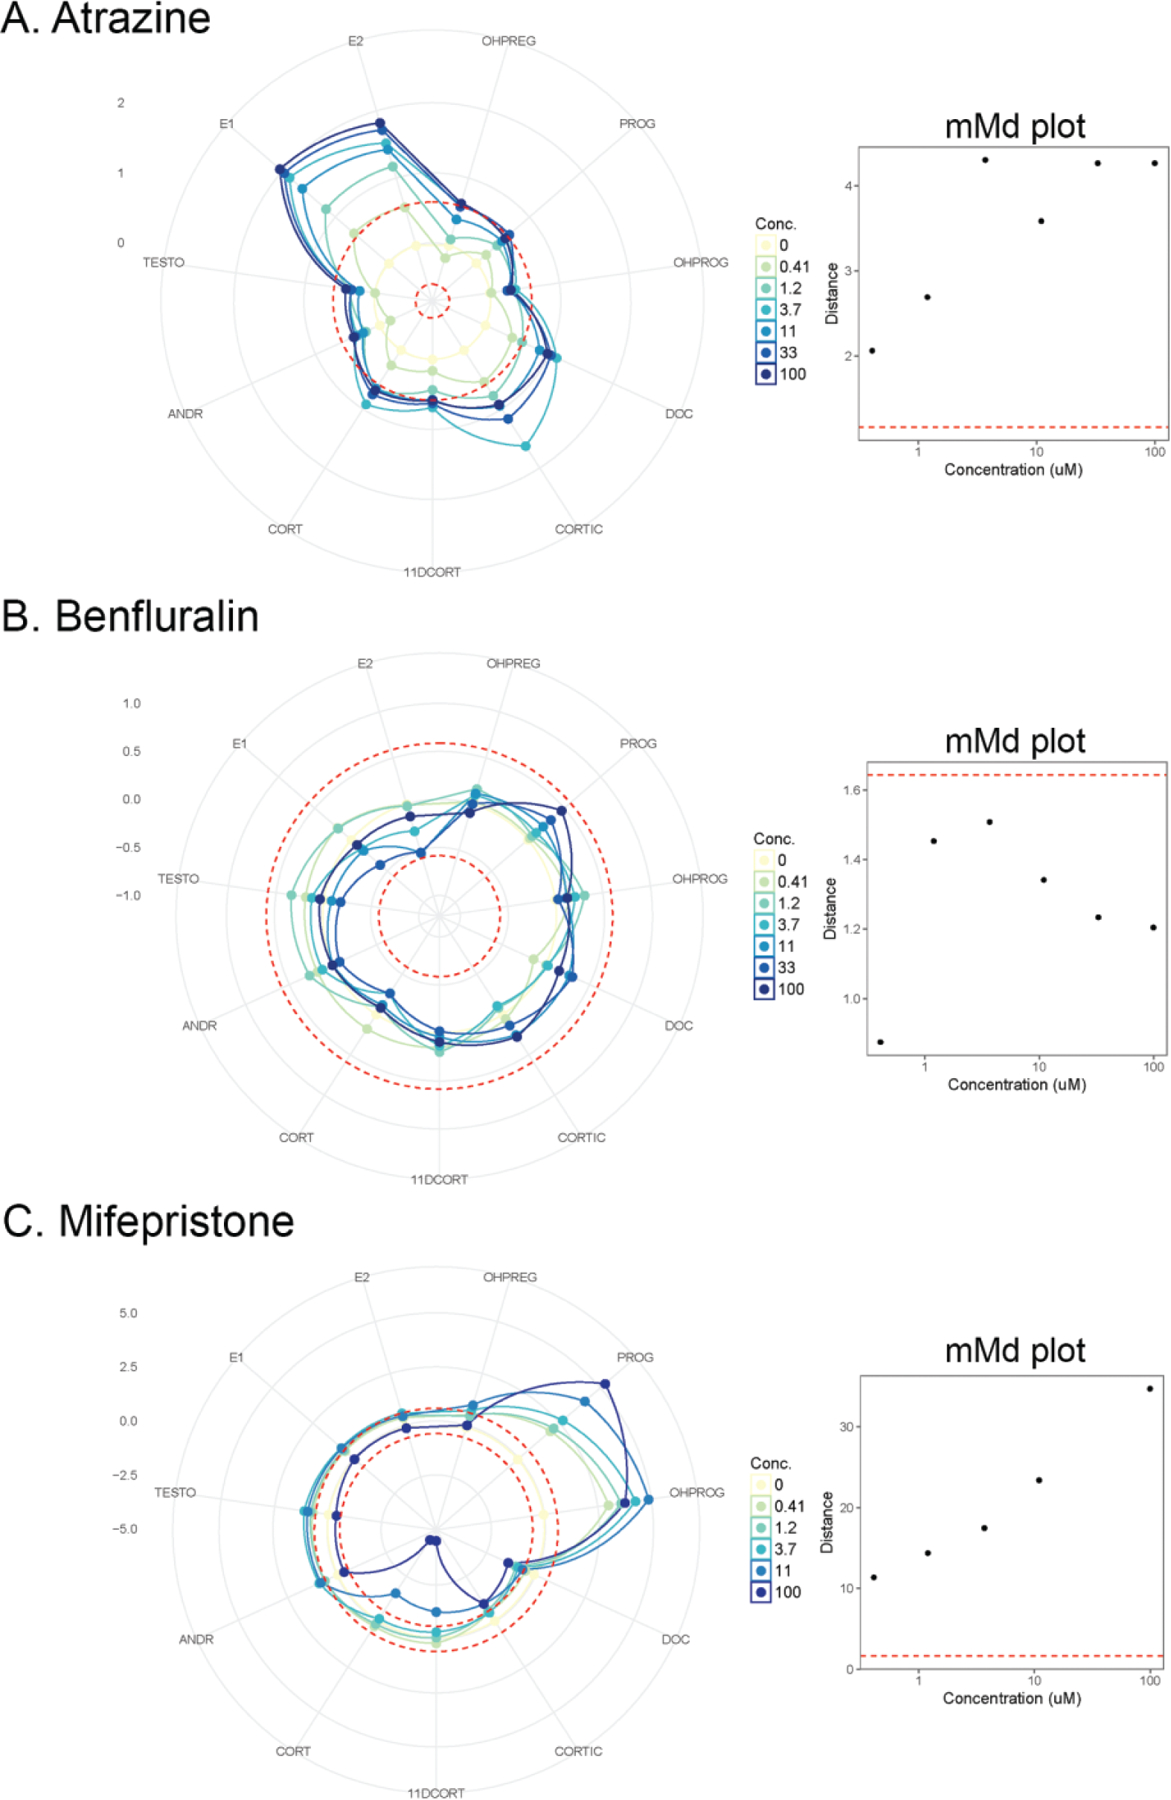
Figure 5.

Example radar plots of the 11-dimensional dataset used to derive a mean Mahalanobis distance () for each concentration assayed. The 11 steroid hormone analytes are represented as the “spokes” of the radar plot, and each concentration of the chemical is annotated by a different color. The dotted, concentric circles denote ±1.5-fold control as threshold to contextualize the responses, as the y-axes vary by chemical to allow for visualization of the relative magnitude of effects. The numbers on the left of each radar plot denotes the fold change values of the major gridlines of the plots. Next to each radar plot is a plot of by concentration, with the critical value for the annotated using a horizontal dashed red line. A, atrazine (CASRN 1912-24-9); B, benfluralin (CASRN 1861-40-1); C, mifepristone (CASRN 84371-65-3). Radar plots and plots are supplied for all chemicals in Supplemental File 10.
