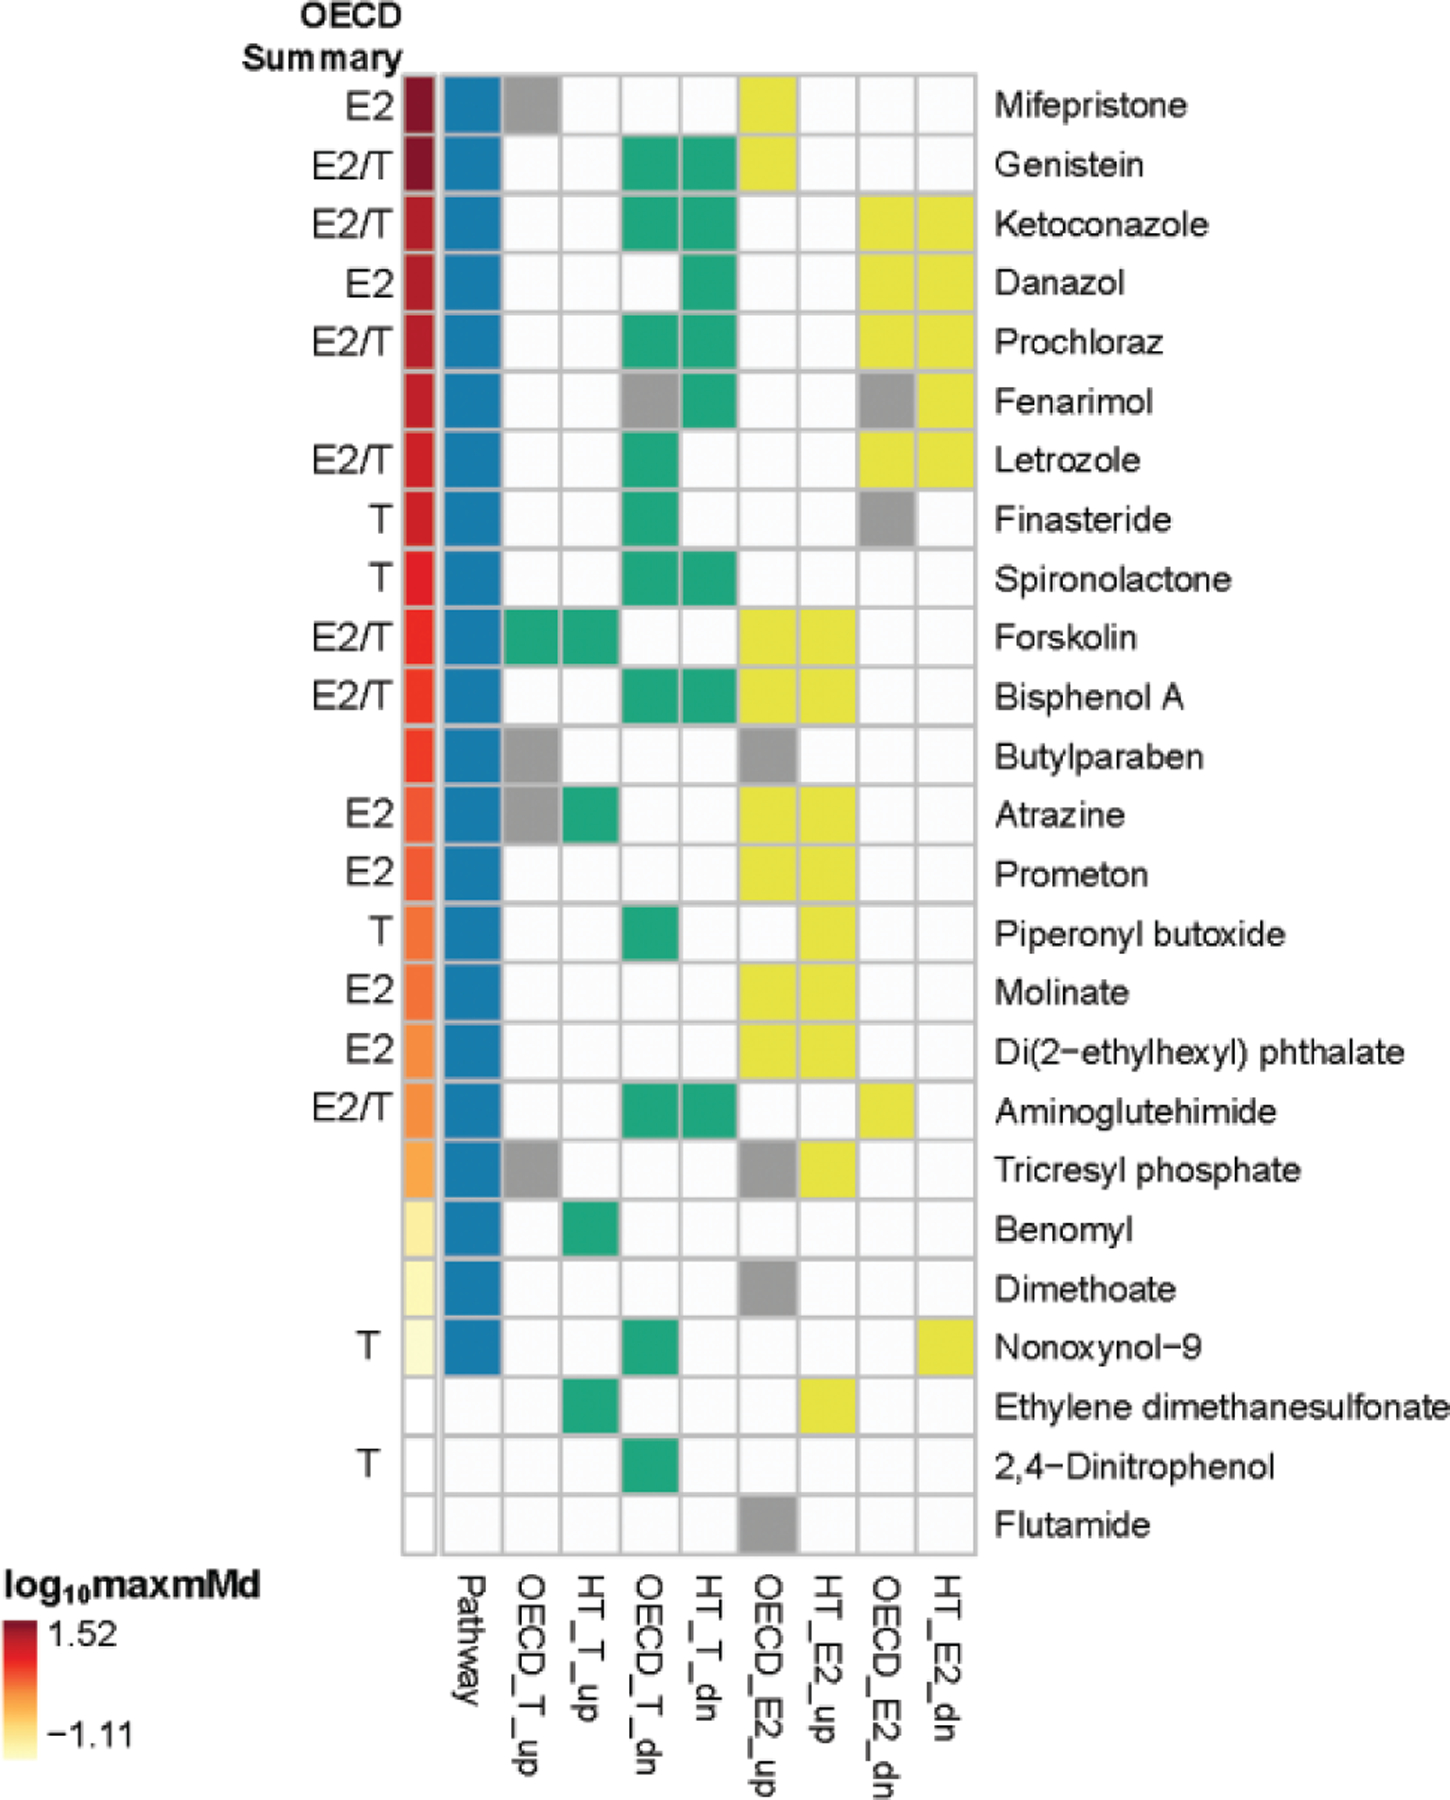
Figure 7.

Geometric tiling to compare the OECD validation and HT-H295R results. For each chemical in the core and supplemental OECD chemical reference sets, a binary comparison of the OECD interlaboratory validation result (OECD_) and the HT-H295R results (HT_) is presented. Positive E2 responses are blocked as yellow, positive T responses are blocked as green, equivocal responses in the OECD interlaboratory validation are blocked as gray, and negatives are blocked as white. Blue blocks denote positive pathway responses (defined as the maxmMd exceeding the critical value for a chemical), and the annotation bar ranks all of the chemicals in the set by their log10 maxmMd from high (red) to low (yellow), white blocks indicating negative pathway results. “OECD Summary” is a text annotation to indicate whether an effect (up or dn) was observed for E2 or T in the OECD interlaboratory validation.
