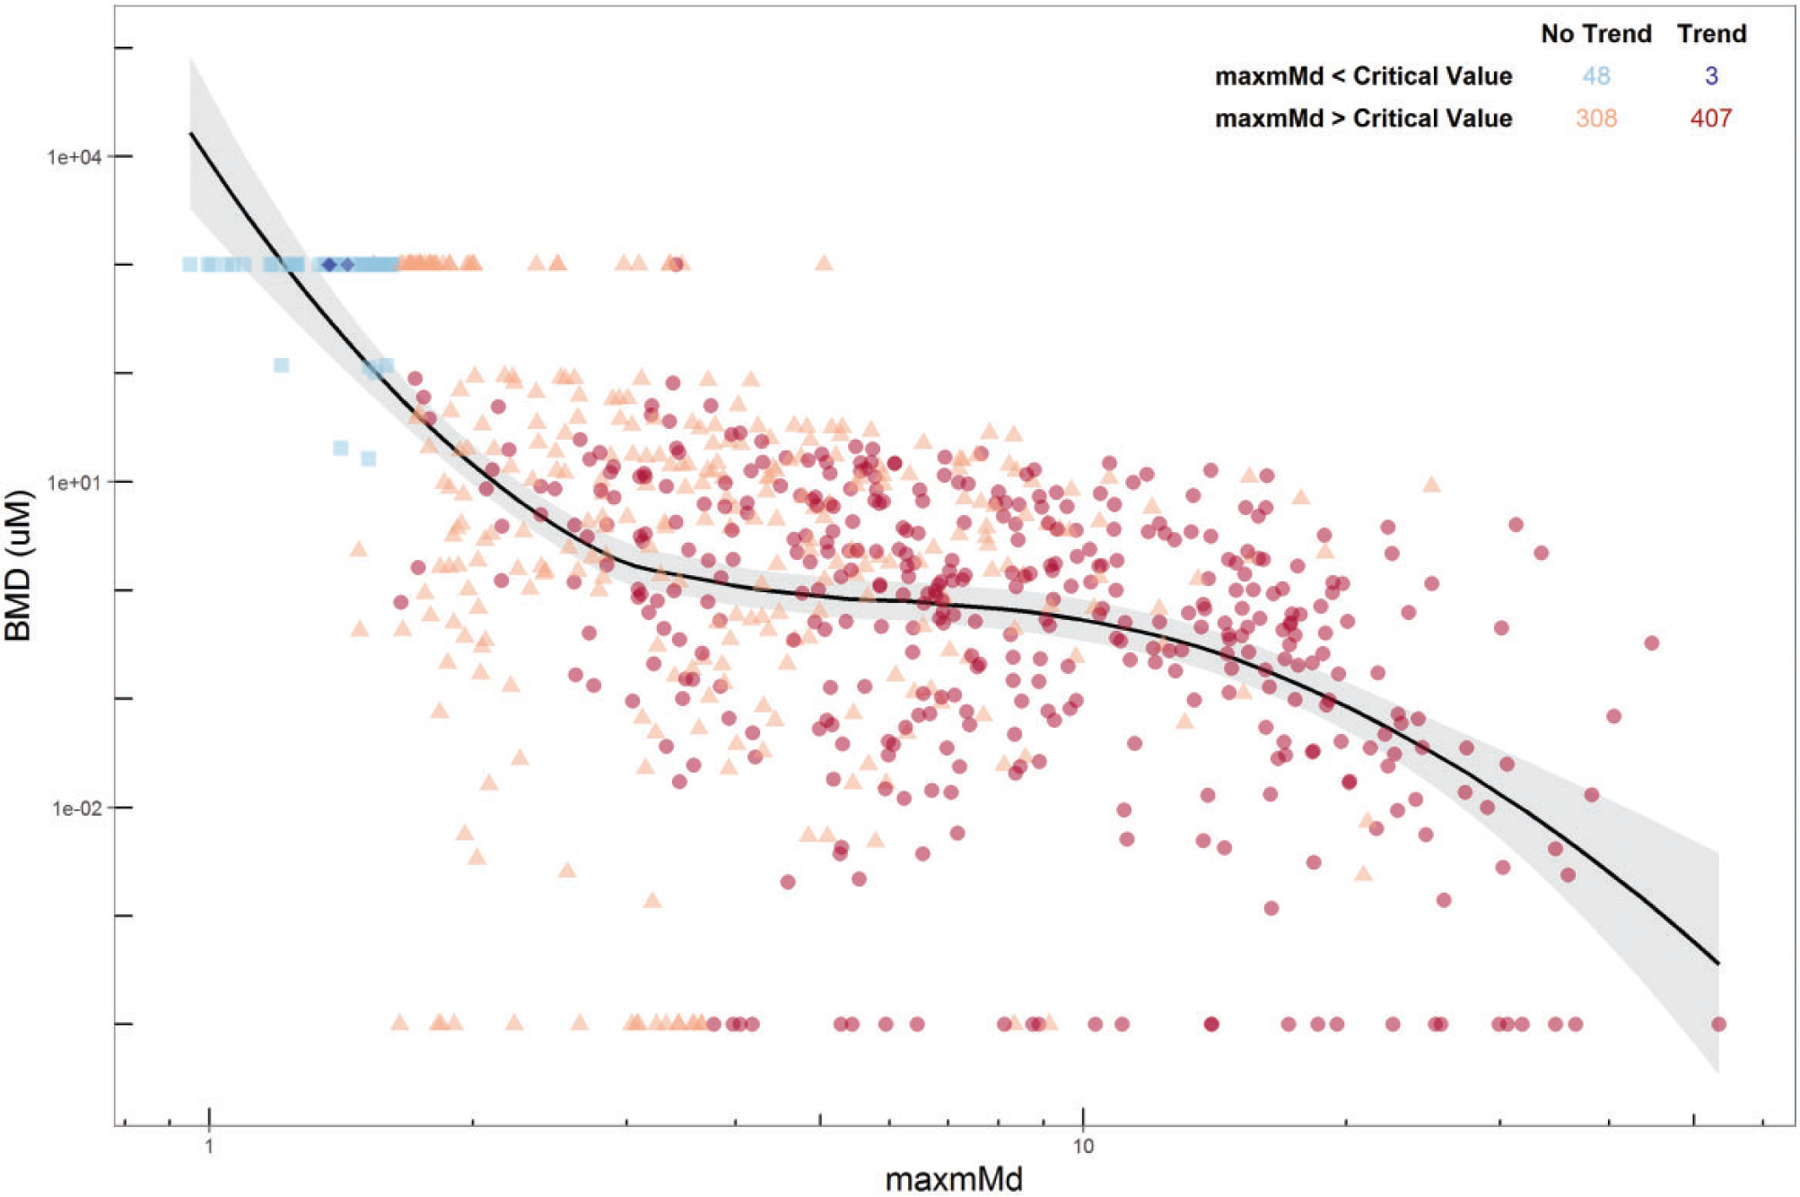
Figure 9.

Estimate of potency versus the maxmMd. An estimate of potency, or benchmark dose () is compared to the maxmMd value. The (μM) is the concentration at which the Hill fit of the data intersects with the critical value for a given chemical. A loess smooth regression line demonstrates a general relationship between and maxmMd. A table summarizing the effects of a Spearman-based trend analysis versus negative and positive maxmMd values is provided in the upper right. Light blue squares = negative maxmMd response and no trend (48 chemical samples); dark blue diamonds = negative maxmMd response and trend (3 chemical samples); orange triangles = positive maxmMd value and no trend (308 chemical samples); red circles = positive maxmMd value and trend (407 chemical samples).
