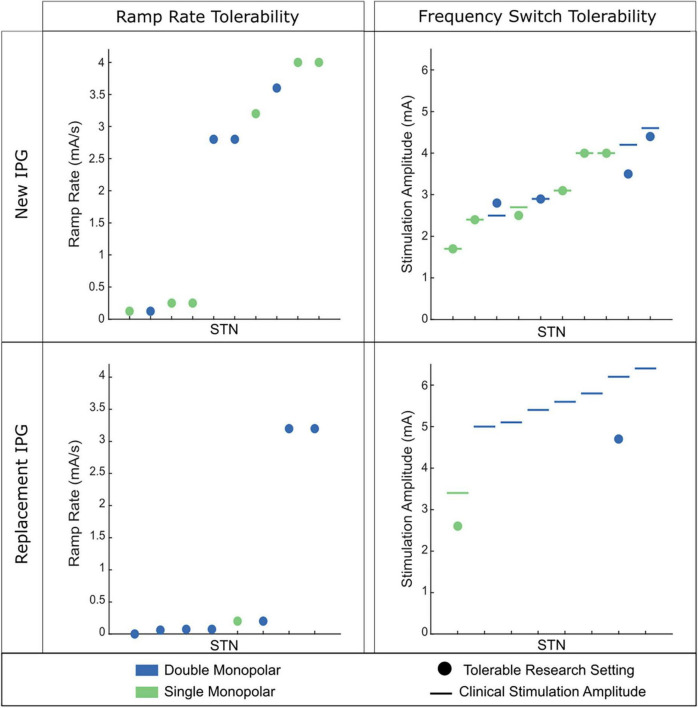
FIGURE 2.
Tolerability of ramp rate across 18 STNs (9 individuals). (Left) Observed tolerability for ramp rate of stimulation intensity. (Right) Observed tolerability of instantaneous frequency switching between 140 and 60 Hz. The participant’s clinical stimulation is represented by the horizontal line. The circle depicts the tolerable amplitude found for frequency switching. If no circle is present, no tolerable therapeutic amplitude was found for frequency switching. (Top) Patient cohort who are on their first IPG. (Bottom) Patient cohort who have had at least one IPG replacement. Green dots indicate the patient had a single monopolar stimulation configuration and blue dots indicate a double monopolar stimulation configuration. Patients on their first IPG showed better tolerability of faster ramp rates of intensity and higher amplitudes for frequency switching. Patients on replacement IPGs rarely tolerated fast ramp rates of intensity or instantaneous frequency switching.

