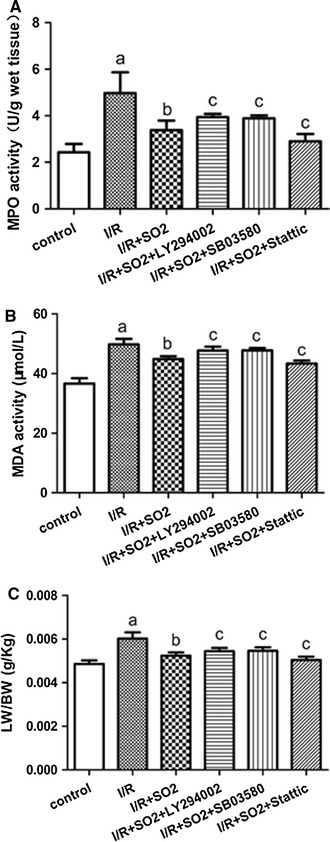
Fig. 2.

MPO activity, MDA activity, and lung coefficient changes in the lung of limb I/R-induced ALI rats in different experiment group. a MPO activity. b MDA activity. c LW/BW. All data are expressed as mean ± SD (n = 8 animals/group). Significant differences are indicated as: a p < 0.01 vs. control group, b p < 0.01 vs. I/R group, c p < 0.05 vs. I/R + SO2 group
