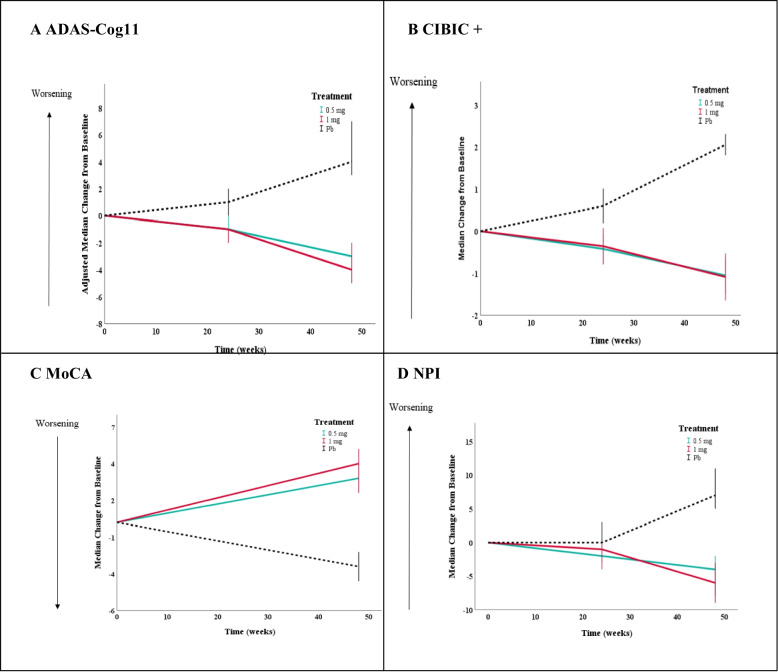
Fig. 2.
Primary and secondary outcomes from baseline to 48 weeks. Panels A and B show results in the modified intention-to-treat population (0.5 mg: n = 57; 1 mg: n = 56; Pb: n = 57). Panels C and D show results in the per protocol population (0.5 mg: n = 50; 1 mg: n = 49; Pb: n = 49). Panel A shows the results for the primary outcome, the score on the 11-item cognitive subscale of the Alzheimer’s Disease Assessment Scale (ADAS-Cog11; range, 0 to 70, with higher scores indicating greater impairment). Panels B, C, and D show the results for the secondary outcomes. Panel B shows results for the change from baseline in the score on the Clinician Interview-Based Impression of Change Incorporating Caregiver Information (CIBIC+; range 0 to 7, with higher scores indicating greater impairment). Panel C shows results for the change from baseline in the score on the Montreal Cognitive Assessment (MoCA; normal ≥ 26/30, with lower scores indicating greater impairment). Panel D shows results for the change from baseline in the score on the Neuropsychiatric Inventory (NPI; range 0 to 120, higher scores reflect greater severity). 95% CIs for median changes were calculated (data was not approximated by normal distribution)

