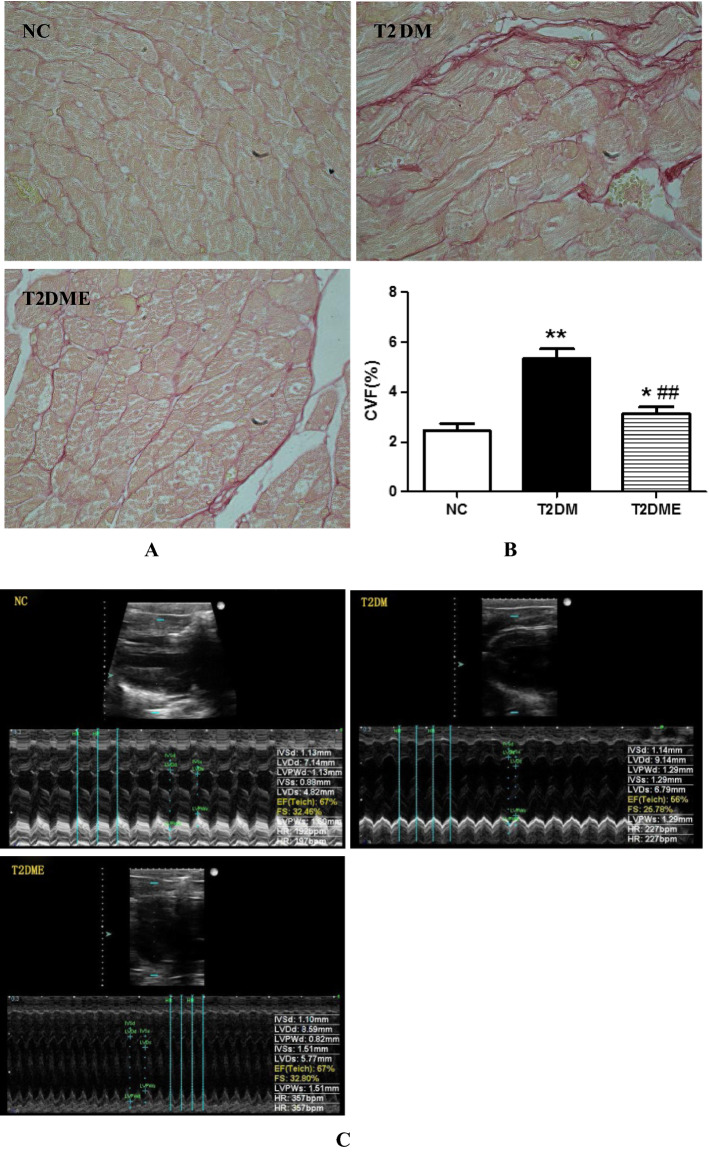
Fig. 2.
Sirius Red staining of rat myocardium and echocardiograms. a Images of Sirius Red staining, non-fibrosis area of myocardium stained brown, fibrosis area of myocardium stained red. Original magnification was ×200. b Percentage of Sirius Red staining–collagen volume fraction (CVF). c Analysis of left ventricular echocardiography. B-mode showing in upper and M-mode showing in lower part of each image. Green dotted lines indicate diastolic (longer) and systolic (shorter) chamber lengths in M-mode. Real-time parameters are shown in the bottom-right corner for each group. NC negative control, T2DM type 2 diabetes mellitus; T2DME type 2 diabetes mellitus plus exercise. *Compared with NC Group, P < 0.05; **compared with NC Group, P < 0.01; ##compared with T2DM Group, P <0.01

