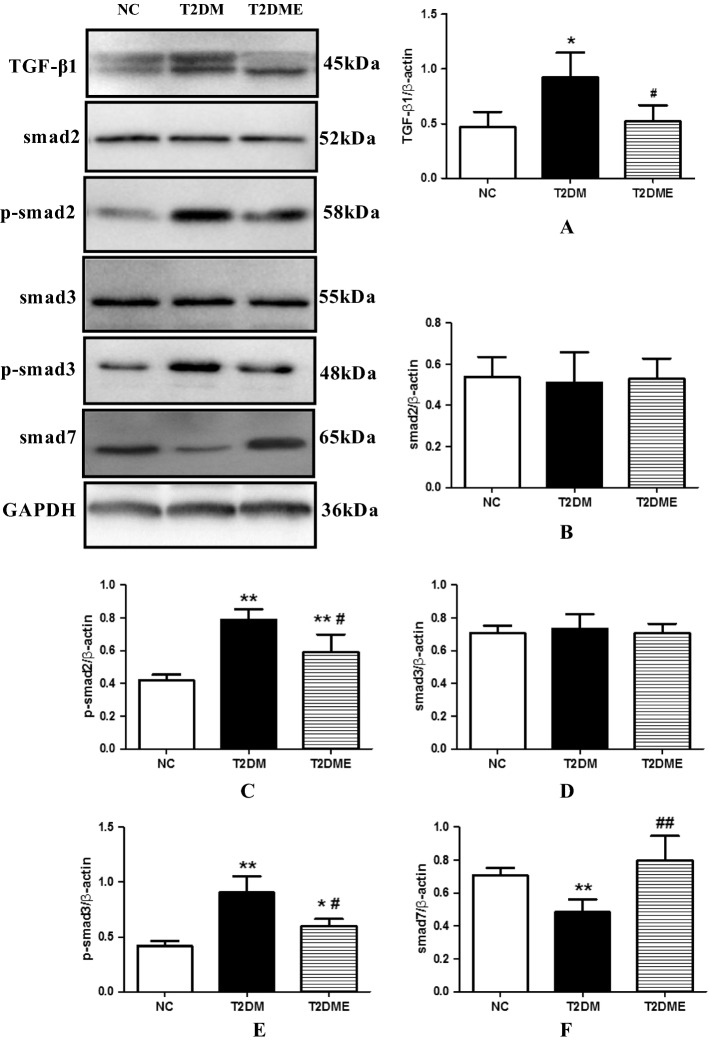
Fig. 6.
Protein expression changes of TGF-β1/smad signaling in myocardium. a Changes in TGF-β1 levels. b Changes in Smad2 levels. c Changes in phosphorylated (p)–Smad2 levels. d Changes in Smad3 levels. e Changes in phosphorylated (p)–Smad3 levels. f Changes in Smad7 levels. NC negative control, T2DM type 2 diabetes mellitus, T2DME type 2 diabetes mellitus plus exercise. *Compared with NC Group, P < 0.05; **compared with NC Group, P <0.01; #compared with T2DM Group, P <0.05; ##compared with T2DM Group, P <0.01

