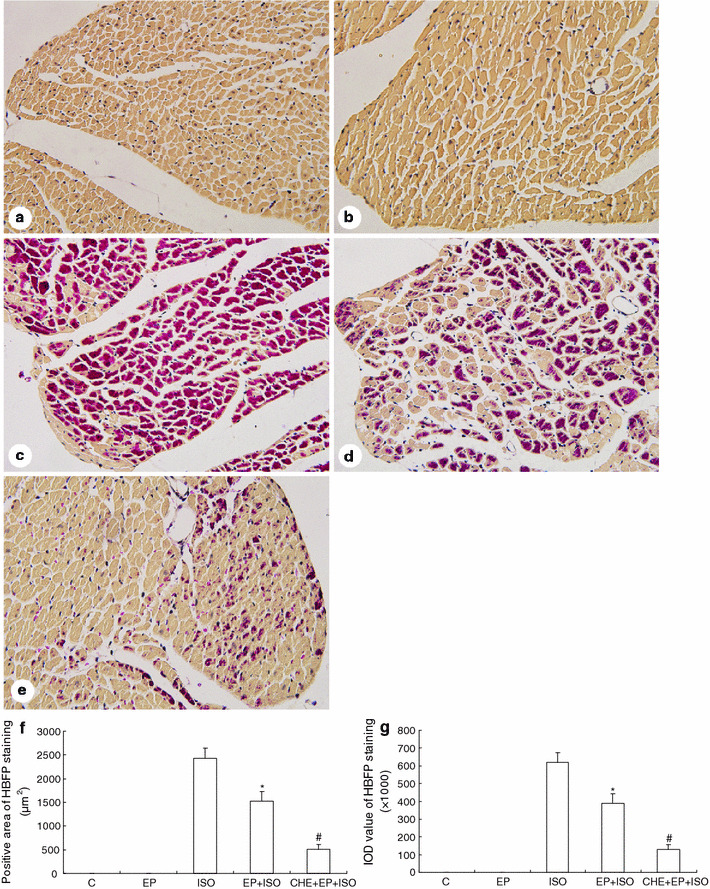
Fig. 2.

HBFP staining of cardiomyocytes of the left ventricular free wall at the level of the near apex and image analysis. a Group C showed all cardiomyocytes with a light brown color. b Group EP showed results similar to group C. c Group ISO showed crimson red stain in the majority of the cases. d Group EP + ISO showed the crimson red patchy stain scattered across the cardiomyocytes, some of which were partly or not stained. e For group CHE + EP + ISO, the red spot stain was only seen in a small fraction of cardiomyocytes. Original magnification, ×400. f Cardiomyocytes in group C and group EP had no positive area. The positive area in group EP + ISO was significantly lower than that in group ISO, and the positive area in group CHE + EP + ISO was significantly lower than that in group EP + ISO. g Cardiomyocytes in group C and group EP had no IOD value. IOD value in group EP + ISO was significantly lower than that in group ISO, and IOD value in group CHE + EP + ISO was significantly lower than that in group EP + ISO. Significant differences (P < 0.05) are indicated as follows: from group ISO (*), from group EP + ISO (#)
