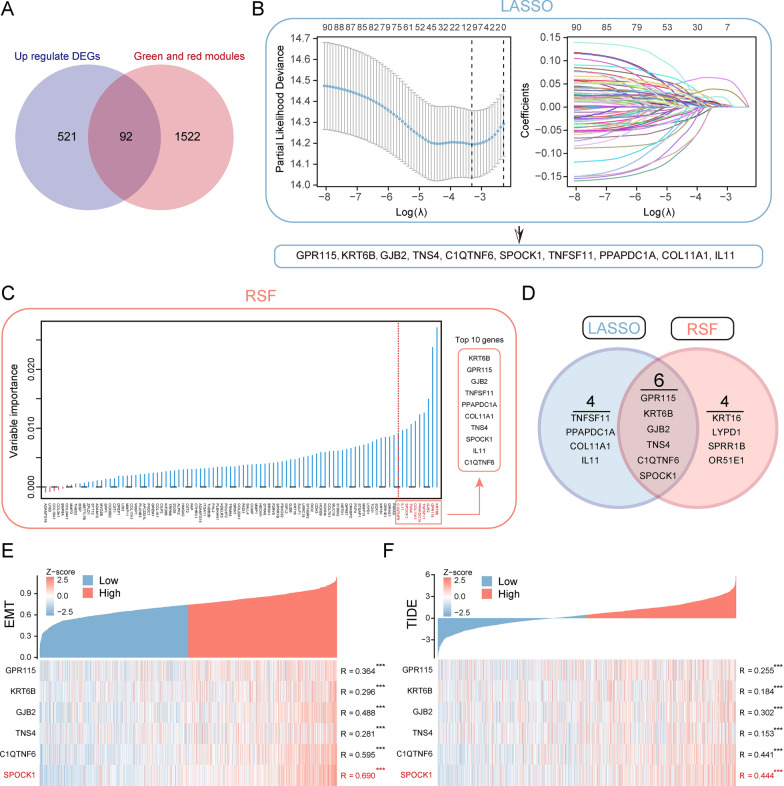
Fig. 3.
Identification of SPOCK1 as a prognostic key gene within the key modules. A Venn plot of the intersection of differentially expressed genes (DEGs) that are abnormally upregulated in tumors and genes within the red and green modules. B Determination of the optimal lambda when the partial likelihood of deviance reaches a minimum. And LASSO coefficient of module candidate gene profiles. C Screening of the top 10 prognosis-related genes in terms of relative importance using the stochastic survival forest algorithm. D Intersection Venn plot of prognostic key genes. Hub genes’ correlation heatmap with (E) EMT score and (F) TIDE score. (***p < 0.001; **p < 0.01; *p < 0.05; ns. no significance)

