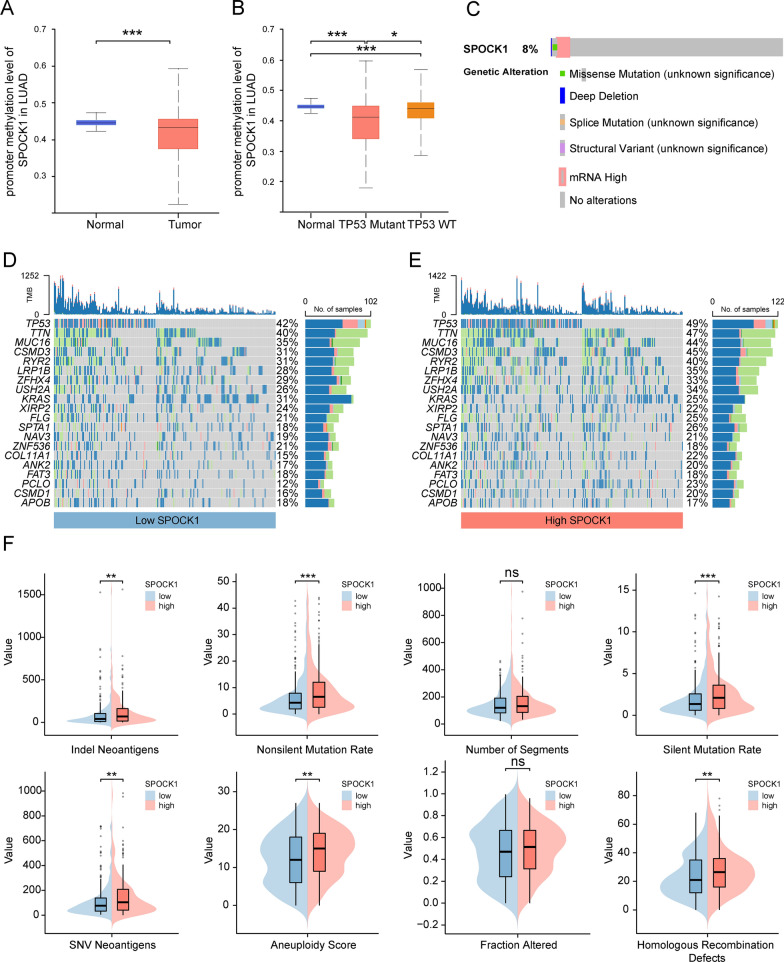
Fig. 5.
Relationship of SPOCK1 with methylation and mutation. Boxplot indicates the extent of variation in promoter methylation levels in LUAD samples from the UALCAN database, (A) in normal and tumor, (B) TP53 mutant and TP53 wild-type groups. C Exploration of the mutational landscape of SPOCK1 in LUAD using the cBioPortal database. Mutation waterfall plots of the top 20 genes in the (D) high SPCOK1 group and (E) low SPCOK1 group in terms of mutation frequency. F Boxplots show the difference of DNA damage measures between different levels of SPOCK1 expression groups (Wilcon rank-sum test). (***p < 0.001; **p < 0.01; *p < 0.05; ns. no significance.)

