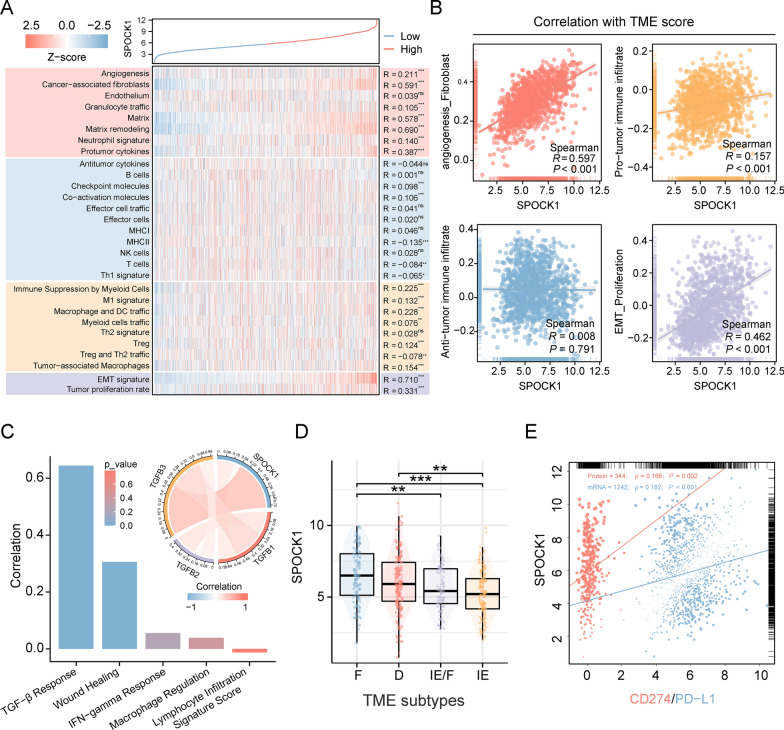
Fig. 8.
Role of SPOCK1 in the tumor microenvironment. A Heatmap of the distribution of 29 TME associated signatures with SPOCK1 expression values. B Scatter plot of the correlation between 4 TME scores and SPOCK1 expression values. C Histogram of correlation between SPOCK1 and 5 immune features and chord plot of correlation with TGF-β1 (TGFB1), TGF-β2 (TGFB2), and TGF-β3 (TGFB3) (spearman test). D Distribution of SPOCK1 expression in TME subtypes defined by Bagaev et al. E Correlation between SPOCK1 and CD274 (mRNA level) and PD- L1 (protein level, from TCPA database) correlation scatter plots. (***p < 0.001; **p < 0.01; *p < 0.05; ns. no significance.)

